Hoisington Investment Management has published a Fourth Quarter 2019 Review and Outlook here, and, as usual, it’s worth reading. Here are some key takeaways:
-
- The U.S. 30-year Treasury bond yield of 2.39% on December 31, 2019, was the lowest yearly close on the 30-year since its inception in 1977, and the annual average yield for long term Treasuries of 2.5% was the second-lowest since 1950.
- Low yields reflect U.S. economic performance that was substantially below expectations in 2019 and consistent with slowing global trends entering 2020. India, Korea, Singapore and Canada are also exhibiting considerable frailty.
- Real yields were more negative in Japan, the euro area and the U.K. than in the U.S.
- The decline in U.S. yields happened amid a large tax cut and increase in Federal spending in 2018 and 2019 that was financed by debt.
- Historical research confirms that the U.S. economy loses 1/3rd of its trend economic growth rate when government debt rises above 90% for five years–the U.S. has met that condition since 2014.
- At the same time, US corporate debt surged to a record 47% of GDP in Q3 2019, 3% above the peak in this ratio in the 2008-09 financial crisis. Total business debt, which includes unincorporated firms, surged to a record 75% of GDP in Q3.
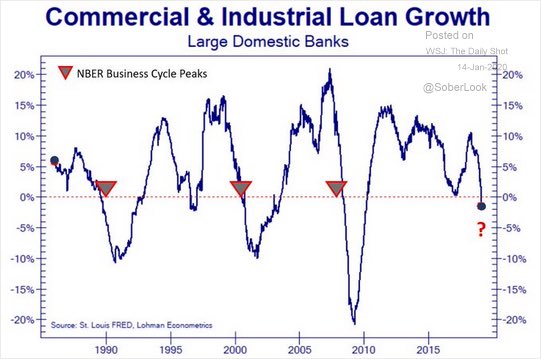
- In the second half of 2019, the growth rate in bank loans and leases decelerated and the two-year annualized growth rate in M2 money supply decreased to a fourteen year low. The decline in bank loans has been a reliable cyclical indicator just prior to all recessions since 1950 (see @SoberLook’s chart below since 1980).
- Although corporate profits after-tax rose $163 billion in the 8 years between 2012 and Q3 2019, the before-tax gain was just $53 billion. The tax cut accounted for 2/3rds of the rise in corporate profits, and in real terms U.S. average corporate profits have declined since 2012.
- The stagnation in profits is reflected in the drop in real capital spending and new orders.
- The total industrial capacity of the U.S. manufacturing, mining and utility companies was 77.3% in November, lower than the peak reached a year earlier and lower than the level at which the economy entered all recessions since 1970.
- Recent OECD data shows that industrial sector capacity has moved steadily lower for all OECD countries over the past 5 years, and confirms that global manufacturing is in a recession.
- The loss of economic momentum, high debt levels, flat profits and excess capacity will continue to bring slower growth, subdued inflation and lower Treasury yields in 2020.
On the topic of corporate loan growth, here is a chart from @SoberLook showing Commercial and Industrial loan growth at large US banks since 1980, with past NBER economic cycle peaks marked by red upside down triangles.