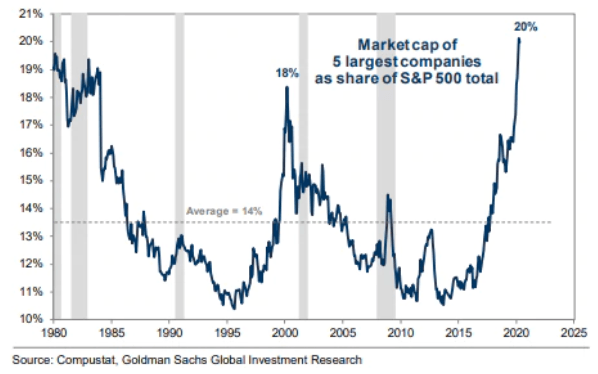
Historically, it is typical for the most widely held, over-valued stocks in a market cycle to have negative or zero returns for many years thereafter. Today, the top five stocks in the S&P 500–Microsoft, Apple, Amazon, Alphabet (GOOGL), and Facebook–make up over 20% of the large-cap US index and 40% of the NASDAQ 100.
As shown below, this level of extreme valuation for the five largest companies surpasses even the fleeting tech-wreck top of March of 2000, whereafter a 78% decline in the tech sector helped the S&P 500 lose 50% of its value.
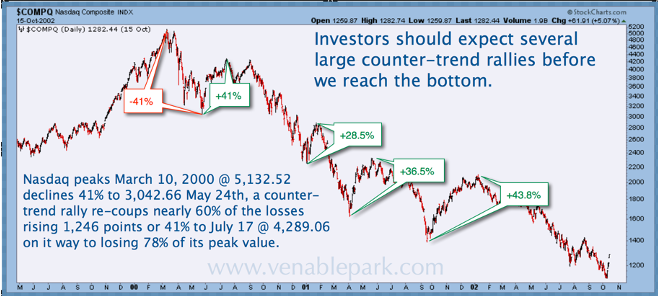
Since March 23, free-flowing funds from governments and central banks have driven a resurgence of animal spirits in market participants and the US stock market has led the world in a price bounce. As shown in my partner Cory Venable’s chart below of the NASDAQ index from March 1999 to October 2000, very similar price action came after the first 41% drop from March to May 2000 as stocks staged the first of four 28 to 43% rebounds, during their 2.5 year mean-reversion journey back to reality.
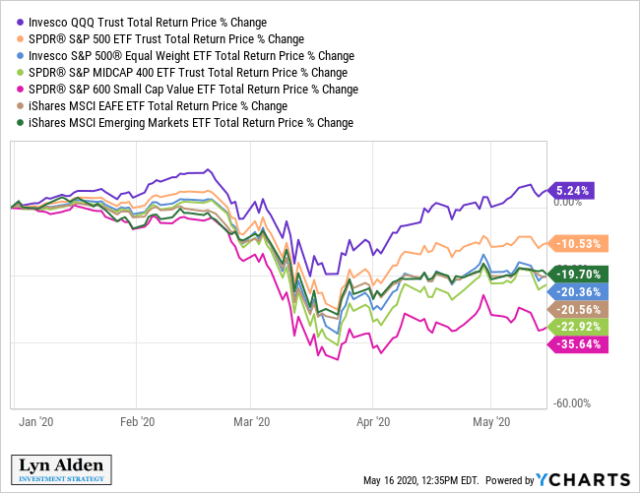
As shown below, today it is once more the NASDAQ 100 (QQQ) index leading the bounce to reclaim a 5.24% gain year to date. At the same time, other economically sensitive small and medium cap companies as well as emerging markets and Europe, Australasia, and the Middle East (EAFE) shown below remain moribund and deeply negative. See First Liquidity, Then Solvency.
The biggest tech darlings are overloved and concentrated in most funds and portfolios today. This is likely to hurt returns from here. It was not until June 2015–more than 15 years later–that the NASDAQ 100 reclaimed its March 2000 peak. By then, most of the original holders had long since liquidated in losses. This time is unlikely to be different.
There is no sign that the 2020 bear market has ended yet. Buy and holders beware.