Danielle was a guest on Talk Digital Network with Jim Goddard, talking about recent developments in the world economy and markets. You can listen to an audio clip of the segment here.
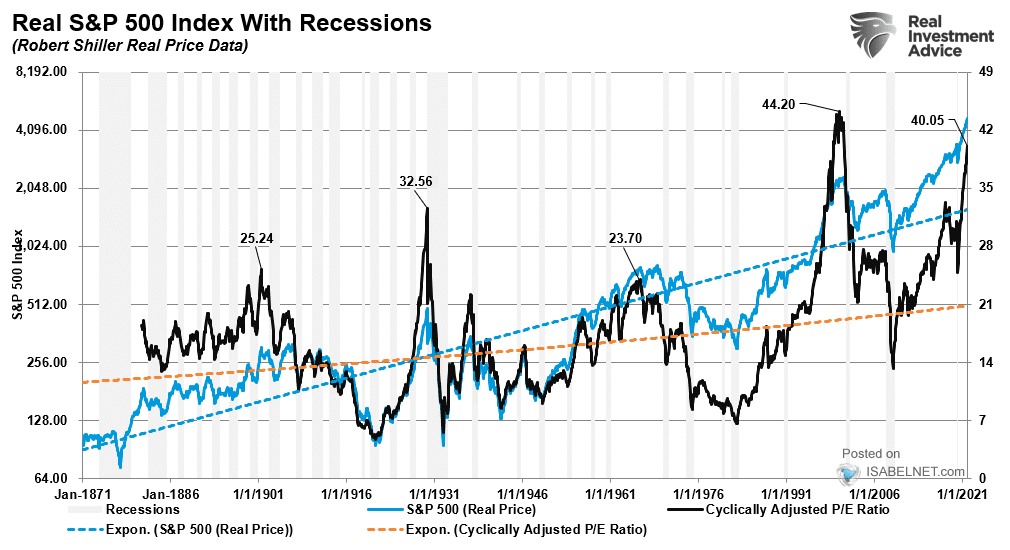
The chart below illuminates the discussion about the five most expensive tech stocks (blue line) holding up NASDAQ returns year to date. At the same time, the remaining components (in yellow) are profoundly negative. Such poor breadth and extreme valuations have proven a perilous combination for subsequent returns in past cycles. Stay alert! The broader S&P 500 Index below in blue since 1870 is, meanwhile, sporting a Shiller (10 year smoothed) PE ratio of 40 (in black), second only to a fleeting 44 at the 2000 top.