Loonie faces one, two punch from oil and housing

Completed unsold condos in TO“A new report from National Bank Financial shows a record number of condos in the Greater Toronto Area were empty in May.
National Bank says more than 2,800 condos were available last month to be sold or rented based on information collected from the Canada Mortgage and Housing Corporation and the Toronto Real Estate Board.”

But no cause for alarm according to industry analysts, see, Real Estate Watch: surge in Toronto condo vacancies is not concerning.  Don’t worry, be happy?

The path of the Canadian dollar now rides on the mean reversion of the secular boom that began in 2001 in commodities, household debt and real estate.

The following chart shows the Canadian dollar since 1985 and its price path after the last domestic boom in real estate peaked in 1990 and recession began (large box on left).
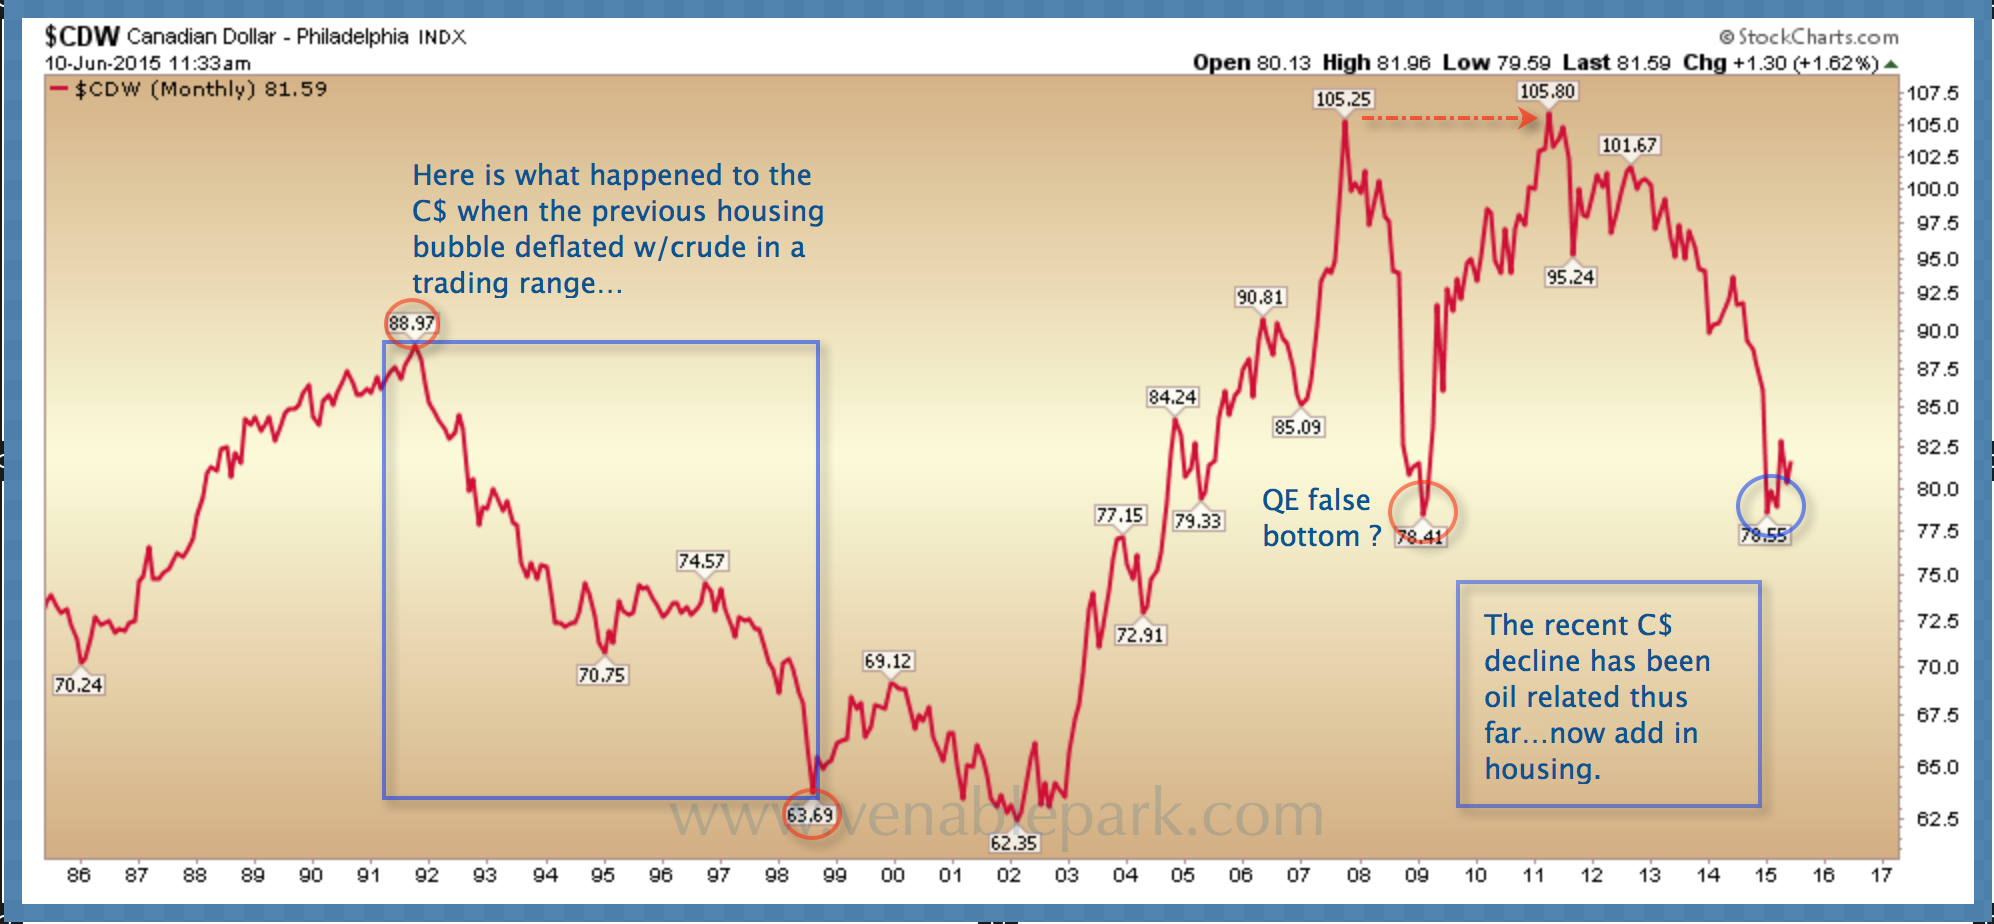
C$ long term view
Oil lost 75% of its value from $40.65/barrel for WTI in 1990 to $10.82 by 1998 and the Canadian dollar and realty prices slumped along with it for 10 long years, before entering the next secular boom phase that began in 2oo1 and ran for a decade into 2011.

A distinguishing feature between the 2002 loonie bottom and today is that housing had floundered for a decade coming into 2002.  Hot money flows coming out of Japan and into North America in the late 80’s (similar to hot flows fleeing China in the recent cycle), helped to balloon real estate prices and leverage; and Canadian households spent the next decade declaring bankruptcy, working down debt and re-building savings.  At the same time, Canadian 5 year mortgage rates were 8% in 2000.  As rates fell over the next 15 years, Canada entered a synchronous secular boom in both commodity exports (to 2011) and household spending (t0 2015).

Fast forward and today the oil (WTI) price has mean reverted some 60% from its 2008 high and the Canadian dollar has so far, fallen 22%.  The trouble is that home prices and credit abuse in Canada today remain at all time highs.  See:  Canadians borrow more than $10 billion annually for home downpayments, for more gruesome details.

The secular mean reversion in commodity prices, spending, credit abuse and realty prices, is likely to persist for several more years and take an extended toll on the Canadian economy and its still jubilant housing sector.  It is hard to believe then, that the loonie has seen its bottom yet this cycle.
Posted in Main Page | Comments Off on Loonie faces one, two punch from oil and housing

Global energy consumption growth back at late ’90’s levels

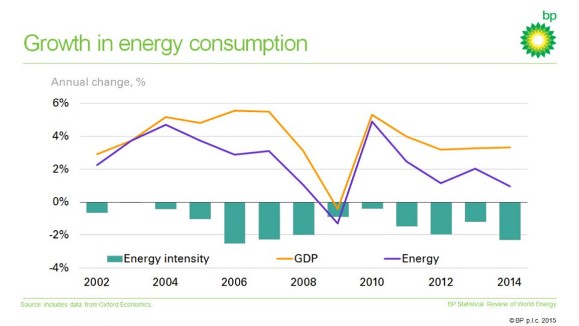
A new BP report confirms that global energy consumption growth slowed markedly last year to the lowest level since the late 1990s other than the Great Recession of 2008-09. See: Global energy consumption at new low in 2014-BP  At the same time, global energy production in all its many forms, has never been higher.
BP oil demand

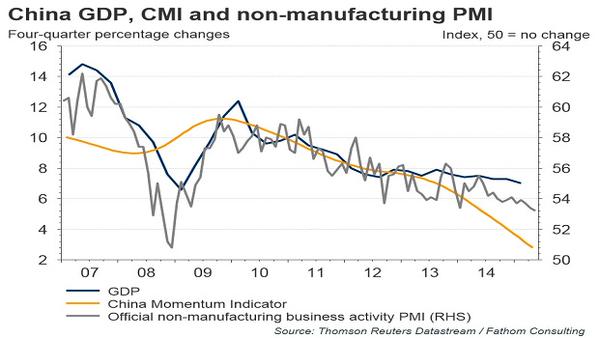
The trend is driven by gains in energy efficiency (which is getting better by the day) as well as slowing global demand led by China where, as shown below, momentum indicators for April suggest GDP growth below 3% annualized, less than half the officially quoted rate.

China momentum indicators

Global primary energy demand growth slowed to 0.9% with Chinese growth at its lowest level since 1998 as its economy was rebalanced away from energy intensive sectors, BP said. China remained, however, the world’s largest market for energy.

Global oil consumption growth was slower last year at 0.8m bbl/day compared with 1.4m bbl/day in 2013. BP said that countries outside the OECD accounted for all oil consumption growth even though China consumption growth was below average.

Natural gas consumption growth was just 0.4%, well below the 10-year average of 2.4%, the review shows. EU natural gas consumption was down 11.6% mainly due, it is thought, to mild winter weather.

Posted in Main Page | Comments Off on Global energy consumption growth back at late ’90’s levels

Gen Xers struggling to gain financial footing

Boomers had a really good run early in their working and saving careers from the early 80’s up to 2000 when the leading age of the cohort began turning 54. Since then a series of asset bubbles and busts, falling income, falling interest rates and crippling debt burdens have made financial stability more challenging for all age groups. Boomers are having to work longer, while delaying and downsizing their previous retirement expectations. But, now age 51-69, Boomers still hold most of the real estate, financial assets, highest paying jobs and positions of influence in governments and corporations today.

The workers coming directly behind the Boomers are not so fortuitous. Life spans are finite, and solid earning and savings years must happen early enough in one’s life time to gain a foothold that can then support future consumption. For Gen Xers the timing of current headwinds, is not good.

Gen Xers are learning that reality really does bite. Now aged 35 to 49, Gen Xers are less confident about their current and future finances and their ability to ever retire than either older baby boomers or younger millennials. Here is a direct video link.

Posted in Main Page | Comments Off on Gen Xers struggling to gain financial footing