Pumpkin pie and points of reference on equity prices

Happy Canadian Thanksgiving…Some historical perspective to digest with Pumpkin Pie.

In the current cycle, both the Russell 2000 small-cap index, and the capitalization-weighted NYSE Composite set their recent highs on July 3, 2014, failing to confirm the later high in the S&P 500 on September 18, 2014. Through Friday, the NYSE Composite is down -7.3% from its July 3rd peak, and the Russell 2000 is down -12.8%, while the S&P 500 is down only -4.0% over the same period. What’s happening here is that selling is being partitioned in secondary stocks, and more recently high-beta stocks (those with greatest sensitivity to market fluctuations). Market action is narrowing in a classic pattern that reflects the effort of investors to reduce risk around the edges of their portfolios, in what typically proves an ill-founded belief that a falling tide will not lower all ships.

See: Hussman’s, Air-pockets, free-falls and crashes.

And the downside mean-reversion needed to resolve present over-valuations and realign with historical experience is barely begun.

The disaster scenario is that some or all of these measures do not just revert toward their long-term averages but instead revert beyond their long-term averages — the way they almost always have before.

If we go from an era with spectacularly high stock prices, spectacularly low interest rates, spectacularly high profit margins, and spectacularly stimulative Fed policy to an era characterized by the opposite (like the 1970s), the sharp crashes and relatively quick recoveries of 2000 and 2008 will seem like brief, happy corrections.

It took about 25 years for the economy and market to correct the extremes of the 1920s. It took another 25 years to fully work off the (much lesser) extremes of the 1960s.

The extremes of the late 1990s, which have extended into the 2000s and, now, the 2010s, are, by some measures, the most extreme in history (including the 1920s).

It should not come as a surprise, therefore, if it takes us as long, if not longer, to work them off.

See: My disaster scenario for some excellent charts. This big picture view of the S&P 500 since 2007 shows the likely downside tests for this cycle.

S&P 500 Oct 13 2014

Posted in Main Page | Comments Off on Pumpkin pie and points of reference on equity prices

Canadian equity market: concentrated capital risk

The theory of diversification is undermined in practice when it comes to the Canadian equity market.  As graphed below, today the widely bench-marked TSX 60 Index mirrored by most equity funds and asset allocators, is in fact a whopping 61% concentration in the financial and energy sectors.
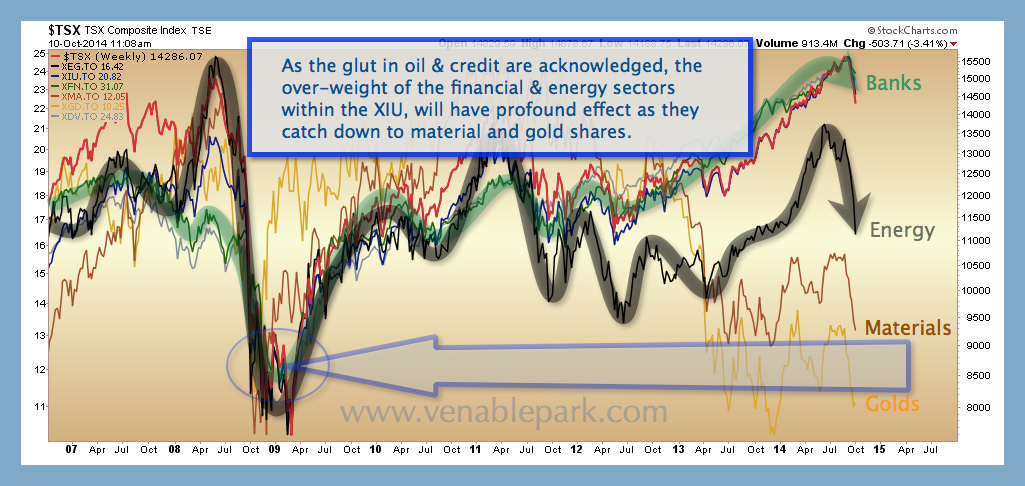
Screen Shot 2014-10-10 at 10.57.49 AM_1024The following chart maps the price performance since 2007 of the broad TSX Composite, TSX 60,  dividend paying Index (XDV), financial index (XFN) (all 3 clustered under green arrow at top of chart), energy index (XEG), materials (XMA) and gold companies (XGD) (as marked).

TSX sectors Oct 10 2014Over 2 years of QE’ mania up to July of this year, dividend-paying share prices went full nut job.  Financial shares (conservative??) surged +100% in 24 months alone as Canadian households moved to DEFCON 1 in indebtedness.  At the same time, the materials and metals sectors have continued to mean revert along with falling global demand since 2010. Since April, energy shares resumed following the real economy lower as all three sectors look to their 2009 lows as potential support.

The bad news for those holding Canadian equity funds and traditionally allocated portfolios today, is that as QE delirium wears off, financial and dividend-paying stocks are likely to recouple once more with the economy-driving–metals-minerals and mining–sectors.

Consider that at decline of 50% in dividend paying stocks would just take them back to their 2012 levels and translate to about -30% for the TSX Index overall. To revisit their 2009 lows would mean losses for these widely touted ‘conservative dividend paying investments’ of about –70% and a broad market decline to about 8000–some -45% from present levels.

It is long past time for complacent holders to review their risk exposure.

Posted in Main Page | Comments Off on Canadian equity market: concentrated capital risk

Ebola blasting robots

Fascinating science…

Morris Miller, Xenex Disinfection Services CEO, explains the disinfection device used at the Dallas Hospital to clean the room where the Ebola patient was treated. Miller discusses the economic benefit to health care. Here is a direct video link.

Posted in Main Page | Comments Off on Ebola blasting robots