China joined the World Trade Organization in December 2001 and global trade entered an era of unprecedented reciprocity. Chinese workers made goods cheap and the west bought trillions by increasing debt at every level from households to corporations to governments.
Each time debt levels approached rational limits, ‘genius’ investment bankers conspired with politicians and product-sellers to conjure fresh tricks to move debts ‘off-book’ and package them into derivatives that made liabilities look like assets. The effect was truly unprecedented and the add debt and stir potion enabled more global consumption than any other period in human history. Until of course, the bubble inevitably burst in 2008 and slumped the world economy into the deep, long pay back period that persists today. Global growth has been coming in at less than half the rate it was in the debt building period to 2008.
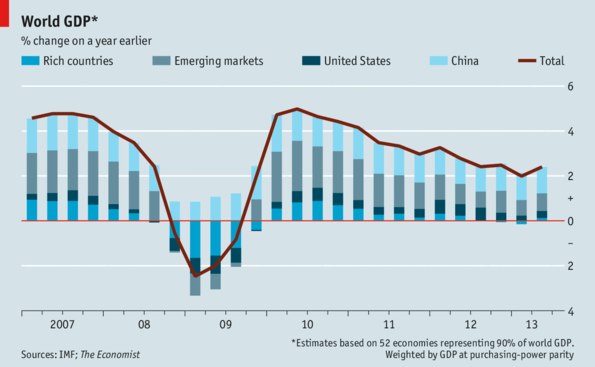 As US debt accelerated, the value of the US dollar plunged by 36% in just 7 years between 2001 and 2008 and commodities priced in US dollars soared. Few indicators reflected the consuming on debt/falling dollar story more than copper.
In this long-view chart of copper since 1980, we can see the sideways range from 1980 all the way to 2005, and then the blow off top from 2005 to 2007 as the property bubble peaked and burst in America and the US dollar bottomed.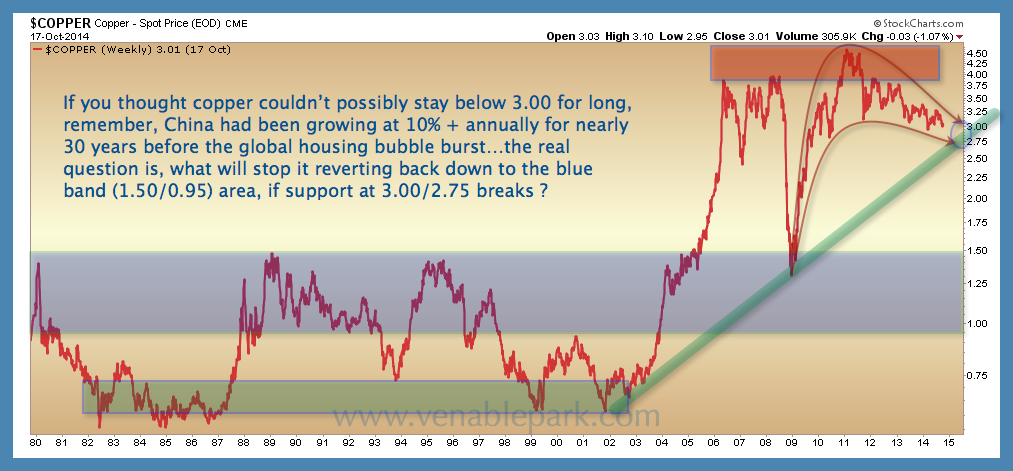 When consumption fever broke at last, realty prices and demand plunged into the great recession of 2008. In response central banks rushed in with ‘liquidity’ backed by taxpayers to rescue the investment bankers and speculators that had enabled the bubble and bust.
At the same time, price fixing and illegal manipulation by ‘market makers’ became a widespread practice across a range of asset markets. As a result, over the past 4 years, even as global demand weakened and copper inventories piled up, copper prices– historically monitored as a global growth barometer–managed to magically levitate north of $3.00 a pound. Last week this changed with copper closing below $3.00 a pound for the second time in 2014, and being the first year it has done so since it rebounded out of the 2008 recession-lows (see above).
For those who think that a breach below $3.00 a pound is surely fleeting, we point out that the pre-credit bubble range of 1.00 t0 1.50 a pound is long-term support, and still some 50% lower than current prices. Food for thought.