Eyes wide open: which market participant are you?

Here is a point of reference for the current market cycle: even after a price decline to date of more than 7% from its most recent March 2014 high, the Russell 2000 small cap stock index is currently trading at a (PE) price to 12 month trailing (estimated) earnings of 83!

Indeed all of the quantifiable measures that have proven historically reliable over full market cycles, advise us that from present valuations, future returns for equity and junk bond holders will be negative on every time horizon over the next 7 years–at least.

Meanwhile, households who liquidated their risk holdings at 12 year lows in both 2002-03 and 2008-09 and ran for the sidelines have been attracted back like bugs to a flame in the past 12 months of QE-induced mania, and are now holding 34% of their net worth in equities once more.  This is a more concentrated risk exposure than at any other time in history but for the late 1990’s. (chart shown here)
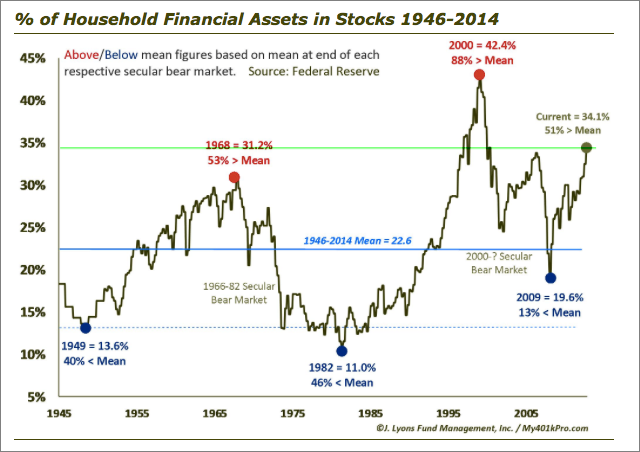
Household assets in stock market

It is quite clear that buyers and holders of equities and junk bonds today fall into one of the following groups:

  1. High frequency traders who purchase advance notice to game the system and skim profits off other slower-moving participants.  These participants don’t typically hold trades for more than a second, never mind overnight;
  2. Those who believe they are ‘long-term investors’ and are irrational or oblivious to the inverse relationship between similar periods of over-valuation and subsequent investment returns;
  3. Fund managers and pensions mandated by their prospectus/constating documents to be perpetually invested in equities and high yield debt at every point in the market cycle, regardless of capital risk or the individual time horizon of their unit holders;
  4. Those paid to constantly sell risk to others and so are necessarily reckless or willfully blind to present negative return probabilities;
  5. Those who are desperate gamblers, doubling down on the miniscule chance that against all odds, they might get lucky and win the lottery.

If you are buying or holding risk assets today, ask yourself a question:  which one of the above 5 categories do I fall into?  Make sure you are comfortable with your answer…

For those who would rather use, high-probability, math based, objective assessments of investment prospects, John Hussman offered a useful overview at the at the 2014 Wine Country Conference last month.  Here is a direct video link.
Posted in Main Page | Comments Off on Eyes wide open: which market participant are you?

The great leverage unwinding now begun

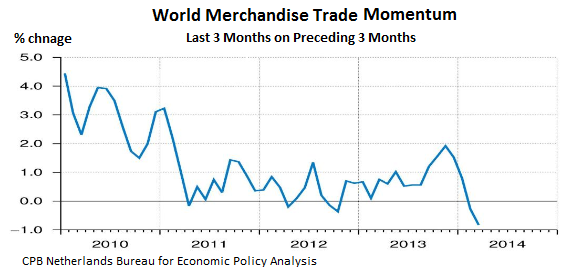
As I have mentioned a few times of late, world trade turned negative in Q1 2014 for the first negative quarter sine the recession of 2008. Thanks to a regular reader in the Netherlands for bringing the following big picture chart to my attention this morning.

World-Trade-merchandise-2010-2014_03-change

While stock bears have pretty much all gone into hibernation in 2014 and bulls have recently been the most confident since the fall of 2007, underneath the surface, some remarkable trend reversals have been underway. Those holding previously hot tech and small cap sectors are not talking much about their losses the past few months, and those who aren’t holding them are largely unaware. But here is a little summary:

“LinkedIn skidded 40.6% from its 52-week high, Twitter 57.5% in five months. It’s not just a few fallen angels. The Russell 2000, which tracks the 2000 smallest stocks in the Russell 3000, is down 9.1% from its 52-week high. The FDN Internet Index 16.1% in three months, the NBI Nasdaq Biotech index 16.5%, the Social Media Index SOCL 24.4%. Stock after stock has taken a brutal licking, papered over by the Dow and the S&P 500 whose components, the largest companies in the US, have largely held up so far. But beneath them, the Fed’s illusory “wealth effect” has begun to reverse.  See:  This happened twice before

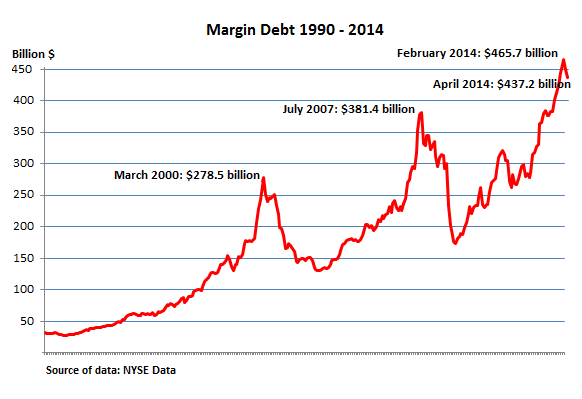
Things like “unexpected” reversals in global trade/growth and rapid implosions in momentum stocks and sectors are all par for every market cycle course.  But since so few people accept or prepare for this fact, it routinely takes heavily indebted and over-leveraged participants by abrupt ‘surprise’. This triggers cash flow shortfalls and margin calls that force selling to raise cash as prices fall. As shown in the remarkable margin abuse chart below, as high beta stocks have plunged since March, margin has finally begun to decline from all time record highs. The last two times this pattern topped and rolled over in March 2000 and July 2007, the selling culminated in 50% declines in broad market prices over the following 24 and 20 months.

NYSE-margin-debt_1990-2014_Apr

 ‘Margin debt – newly created money that is plowed into stocks – is the great accelerator on the way up. It inflates values and increases leverage, and when it spikes, it performs miracles. But it has a terrifying habit: after going into a majestic spike, it reverses abruptly right around the time stocks crash.

Over the last 15 years, margin debt had three spikes and reversals:

The first spike peaked in March 2000 at a record of $278.5 billion, or 2.66% of GDP. By the time it reversed in April, the stale air was hissing out of stocks with epic speed.

The second spike peaked in July 2007 at $381.4 billion, or 2.60% of GDP. In November, stocks began to swoon. No one will ever forget what happened next.

The third spike – the most phenomenal yet – peaked in February 2014 at $465.7 billion, beating the prior record by 22%. It reached 2.73% of GDP, the highest ratio ever! In March, the spike reversed. And in April, it declined again.’

Posted in Main Page | Comments Off on The great leverage unwinding now begun

ECRI: the mainstream can’t bear to contemplate the next recession

First quarter US GDP came in at a negative 1% yesterday led by a 7.5% fall in business spending following the expiry of tax concessions that had brought forward investment in 2012 and 2013.  The US is caught in a Japan-style conundrum of endlessly employing artificial stimulus to steal a little extra growth from the future and spend it yesterday.  The trouble is the future keeps arriving with less and less demand as a result.

“We think there is more to this than just weather. Our leading indicators were already weakening late last year,” said Lakshman Achuthan, from the Economic Cycle Research Institute (ECRI)…

The concern is that this recovery may die of old age after five years, even though it has been the weakest expansion since the Second World War, failing to close the output gap or bring the long-term unemployed back into the workforce. The Fed fears it has exhausted its arsenal. “It is too awful to think about what will happen in the next recession, so nobody does,” said Mr Achuthan.”  See:  US money slump flashes warnings as economy slumps.

And yet it is coming, ready or not…

Posted in Main Page | Comments Off on ECRI: the mainstream can’t bear to contemplate the next recession