Recession alarm with no false positives

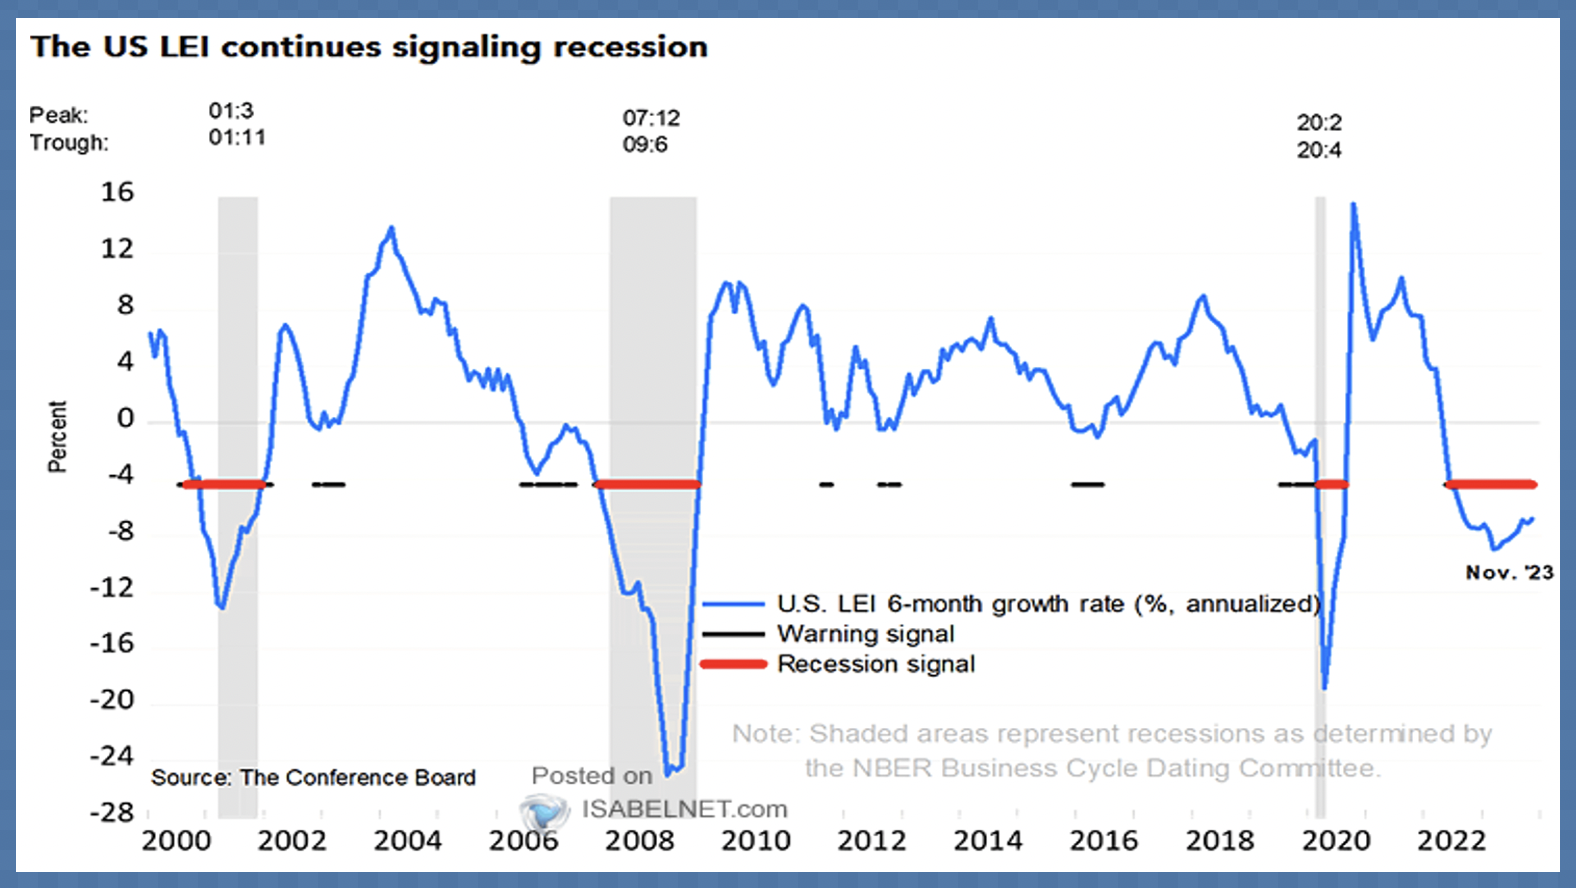
There has never been an incidence in history where the US Conference Board Leading Economic Index (LEI) had a six-month average growth rate sub -4.5%, and the US economy did not enter an NBER-defined recession.

The six-month smoothed LEI growth rate in November was -7.5% (chart below since 2000, courtesy of ISABELNET.com) and has been negative for 20 consecutive months, something only seen before the 1974 and 2008 recessions (stock markets halved and unemployment leapt during both).
(The 10 data points in the LEI are the leading credit index, S&P 500 stock prices, yield spread between the 10-year treasury and the Fed funds rate, average consumer expectations for business conditions, ISM new orders, building permits, average weekly hours worked in manufacturing, manufacturing new orders, consumer goods orders, average weekly initial jobless claims).

When we combine the sub -4.5% LEI trend with the inverted 10-year minus 3-month yield spread and falling Gross Domestic Income (GDI), the warning of incoming recession has never been louder. Yet, most are ill-prepared.

Economist Eric Basmajin does an excellent job of explaining the significance of these signals in the segment below.

Explore the reliability of the Conference Board Leading Index, a recession indicator with a flawless track record spanningic  six decades. This video delves into the current -7.5% growth rate, compares it with other indicators, and challenges the optimistic narrative driven by recent stock market performance, emphasizing the importance of staying vigilant to potential economic downturns. Here is a direct video link.

Posted in Main Page | Comments Off on Recession alarm with no false positives

Financial cycle behavior is consistent

In June 1999, the US Fed began an 11-month rate hiking cycle that took the overnight rate from 4.75 to 6.5% by May 2000. Amid tech-mania-inspired irrational exuberance, the S&P 500 hit 1527 by March 2000, sold off into the summer, and rebounded to double top at 1521 by September on soft-landing forecasts.

What unfolded was, in fact, a mild 8-month US recession from March through November 2001, with the unemployment rate rising to June 2003. The stock market did not bottom until September 2002, when the S&P reached 688–54% below its March 2000 top.

Canada did not experience an official recession in the 2000-02 cycle, yet the TSX Composite followed US markets in lockstep, falling 52% from August 2000 to October 2002. The stock market would not reclaim its 2000 cycle top for five full years in September 2005. The tech-heavy Nasdaq, which fell 78% between 2000 and 2002, would not reclaim its cycle peak until 16 years later, in July 2016.

After leaving the overnight rate at a debt-stimulating 1% from June 2003 through June 2004, the US Fed finally began a two-year tightening cycle that took the overnight rate to 5.25% by June 2006. With the usual delay between interest rate changes and the real economy, home prices in the US and other countries entered an epic bubble that began to burst in 2006. Still, stock prices rallied on. The S&P 500 hit 1553 in July 2007, sold off into the summer and then double-topped around 1565 that October on soft-landing confidence. The US economy entered the ‘Great Recession’ from December 2007 through June 2009, with the unemployment rate rising to January 2010.

This time, Canada experienced its recession from October 2008 through May 2009, with its unemployment rate rising until the fall of 2009. Coming into the 2008 recession with less debt and less inflated home prices, Canada’s economy fared better and recovered faster than many other countries. Still, Canada’s stock market followed the US decline in lockstep, with the TSX Composite peaking in October 2007, double-topping into May 2008 and tumbling 47% into March 2009. The TSX did not durably surpass its May 2008 cycle top until December 2020–more than 12 years later.

In November 2007, as soft-landing advocates were loud and stocks still rich, I wrote a blog article, Looking Up From the Minutiae to See the Big Picture. It turned out that the takeaways were prescient then and bear repeating now.

And so we see that a person who held Government of Canada bonds and T-bills throughout the past 8 years would actually have fared better than the vast majority of investors.

Those who avoided passive allocation strategies in equities over the past 8 years actually did not miss the boat. They caught the lifejacket. They missed out on the agony, angst and upset of large market losses and emotional trauma.

The long always industry is still selling everyone this passive, buy and hold bill of goods. And most investors, sadly, will continue to suffer the consequences unless, of course, they WAKE UP and see that there is a better way.

As in 2000 and 2007, at current levels, stocks are priced to underperform the safest bonds over the next several years. History never repeats exactly, but financial cycle behaviour is remarkably consistent. We can use that knowledge with discipline to our benefit.

Posted in Main Page | Comments Off on Financial cycle behavior is consistent

Home listings rise as sales stagnate

Rebounding Treasury bond prices have lowered mortgage rates from their cycle high in October, but home prices at current mortgage rates are still painfully unaffordable for most.

The Bank of Canada estimates that 45% of Canadian homeowners saw their mortgage payments rise in 2023, and 50% of mortgages initiated before March 2022 will face higher rates by the end of this year. The average payment increase is expected to be 34% and 54% for the most indebted households.

At the same time, home sale volumes have fallen from a national peak of 76,259 in March 2021 to 35,013 in November and an average price of $816,720 in February 2022 to $646,134 in November, a decline of 21% (WOWA chart below).

Would-be-sellers are being advised to hold off until the spring, hoping that lower interest rates will yield more buyers by then. Not everyone can wait and hope, though. Listings are rising, especially in areas where homes are the least affordable. See Hoping for early spring in a chilly housing market.

In November data, new listings in the Greater Toronto Area (GTA) were up 19% year-over-year to 10,545, while active listings soared 41% to 16,759 and far outpaced the 7% decrease in GTA home sales over the past year, down to 4,236.

The average home sold price in the GTA was $1,082,179 for November 2023, representing a decrease of 4% month-over-month and more than 17% lower than the cycle peak in early 2022. GTA home sales accounted for 12% of all Canadian home sales. The GTA had a sales-to-new listing ratio (SNLR) of 40% in November, up from 37% in October. An SNLR under 40 is considered a buyers market. John Lusink, president of Right at Home Realty and Property.ca, says the market is stuck. Buyers point to low sales volumes for negotiating a reduced price, while sellers point to flat year-over-year prices as a reason to hold firm.

Trends are not seller-friendly. Mr. Lusink says the inventory of listings on his site was 40% higher in December compared with the same month last year and 100% higher compared with December 2021. For more, see: Toronto just saw the worst year for home sales in 23 years.

Posted in Main Page | Comments Off on Home listings rise as sales stagnate





