2024 starts rough

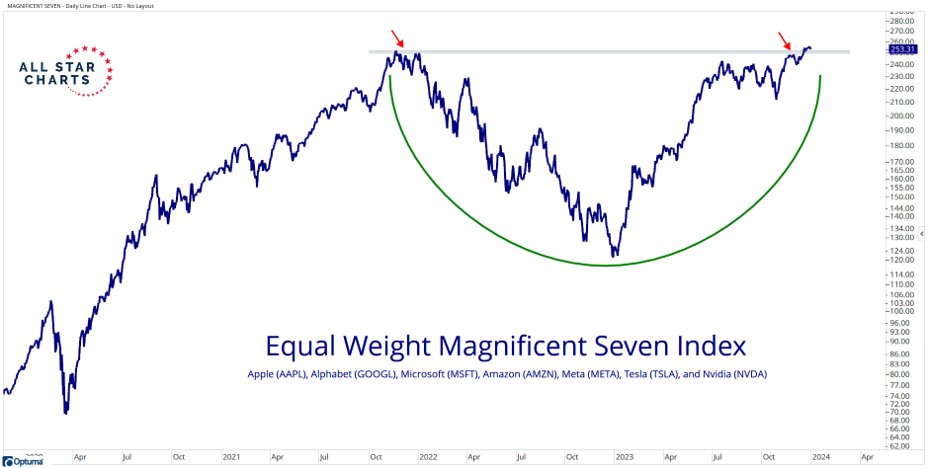
Assets bid up by irrational amounts eventually end up on clearance sale. Always. This is something to remember with the seven most expensive tech companies ending 2023 at their October 2021 price peaks (chart shown below, courtesy of All Star Charts), even while the Fed funds rate has moved from .25 to 5.5% and earnings estimates are falling. Sure, this handful of stock all-stars have spent two years going nowhere with tons of volatility, but who cares?

Permabulls are emboldened. The CNN Fear and Greed sentiment index is back in the extreme greed zone. Lessons learned: zero.

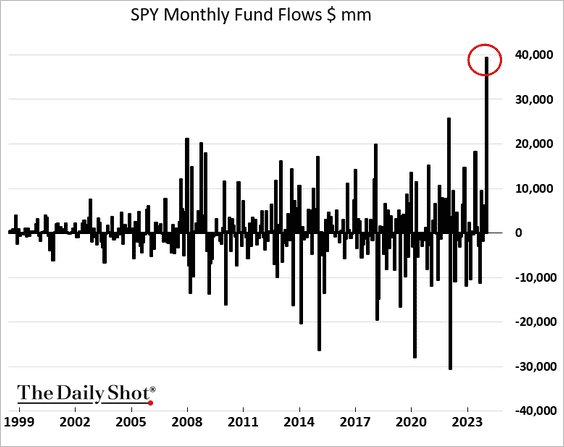
Making up a record 31% of the S&P 500 and 45% of the Nasdaq market capitalizations, the ten most expensive tech companies attracted trend-following flows into the bloated S&P 500–a CAPE above 30x in December–by the highest dollar amount on record (chart below since 1999, courtesy of The Daily Shot).

Rebounds in the few have masked ongoing price weakness in the majority.

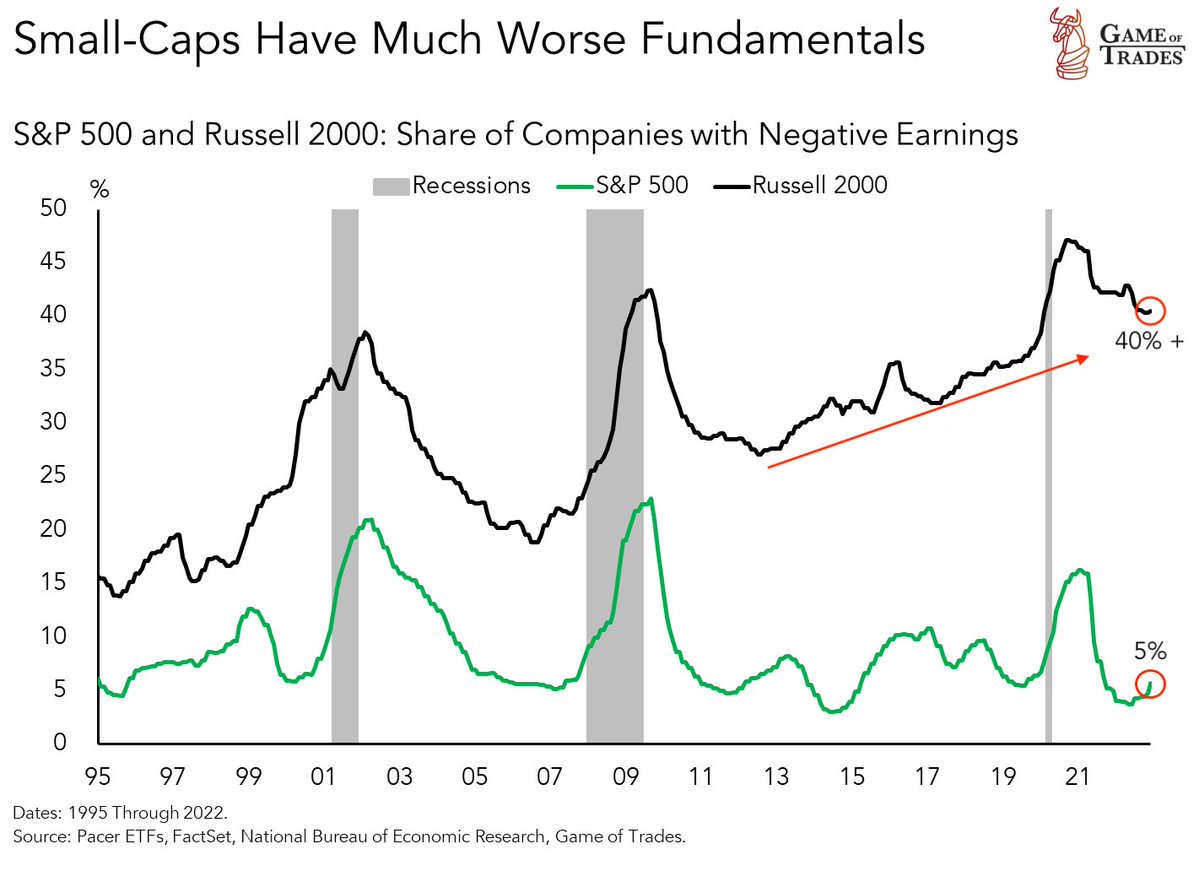
Even though many companies borrowed long when interest rates were at 5000-year lows during 2020-21, the level of debt matters and forty percent of Russell 2000 companies had negative earnings in 2023–alarmingly high in a non-recession year. The negative earnings share was half that amount heading into the 2001 and 2008 recessions, and then it doubled (see grey bars below since 1995, courtesy of Game of Trades). Credit spreads on publicly-traded ‘hi-yield’ debt started 2024 at a complacent 321 basis points over similar-dated Treasury bonds–much too low for the capital risk inherent. Past bear markets have not bottomed until high-yield spreads have widened to more than 7oo basis points, with junk bond prices dropping with equities.

Large-cap companies are typically more financially stable but still saw a tripling of the negative earnings share during past recessions. The S&P 500 money-losing share at 5% today (in green below) is due to move up from cycle lows. After spiking on hopes for rate cut miracles in 2024, the S&P 600 small-cap stock index (in green below since mid-2021, courtesy of my partner Cory Venable) ended 2023 still -9% from the October 2021 top. Late cycle tech out-performance in the 2008 top (circled in the inset box below) resolved with the S&P 500 following small-cap stocks into a halving. Often, January clocks stock market gains following tax-loss selling in December. But after manic buying last month, this year might be different. Yesterday’s -1.6% was the worst annual start for the tech-centric Nasdaq since 2016, and economically sensitive small caps, transports, and commodities all followed lower.

Posted in Main Page | Comments Off on 2024 starts rough

Danielle on This Week in Money

Danielle was a guest with Jim Goddard on This Week in Money, talking about recent developments in the world economy and markets. Here is a direct audio link, starting at 7:24 on the playbar.

Posted in Main Page | Comments Off on Danielle on This Week in Money

Bonds are pricing storm clouds that equities are ignoring

Bonds are betting that falling inflation and rising unemployment will prompt policymakers to cut interest rates next year aggressively.

After selling off in 2021 and 2022, the world’s bond market has rebounded sharply into year-end. The Bloomberg Global Aggregate Total Return Index (shown below) has risen nearly 10% over November and December, its best two-month run in data going back to 1990. Canada’s 10-year Treasury bond has rallied 15% since October 2, 2023, and the US 20-year Treasury ETF (TLT) over 20%, recently breaking above its downtrend that had held since late 2021 (chart below from my partner Cory Venable).

As rate cuts begin, government bonds typically rise further on safe-yield-seeking inflows.

Stocks have rebounded, too, on terrible breadth. Over the last three months, the widely-tracked S&P 500 index has recovered near its all-time high of January 3, 2022 (when base interest rates were .25 versus 5.5% today), with a 31% concentration in the ten most expensive tech stocks. Under the surface, 72% of S&P 500 stocks have underperformed the index this year–the highest percentage underperforming since 1980 (see red line below, courtesy of The Kobeissi Letter).

The relative price of the S&P tech sector versus other sectors is more than two standard deviations above the historic mean–something that’s only happened twice since 1926 (blue line below, courtesy of ISABELNET.com). The two other times, 1966 and 1999, preceded secular bear markets where tech shares led broad stock markets into multi-year drubbings. While portfolio allocations have retreated with stock prices since 2022, the buy-and-hope masses still have an optimistic 60% of their savings in equities and far above the 40% average near past bear market lows (see 2009 below, courtesy of ISABELNET.com). The retail net worth allocation to government bonds is less than 5%. Current allocation weights are likely to prove painful. Government bonds are among the few assets that typically deliver positive returns during recession-inspired rate-cutting cycles, while equities endure 80% of their cycle losses as recessions and rate cuts unfold (blue bars in the table below since 1933).

Government bonds see the storm clouds hanging over the world economy in 2024; stocks are, so far, still ignoring them. When reality dawns, great opportunity unfolds for those who have prepared.

Posted in Main Page | Comments Off on Bonds are pricing storm clouds that equities are ignoring