
Buying power has halved, do the math

Home listings and price reductions are popping up like measles. You can see this by signing into Zillow (or many other sites). Meanwhile, offers are increasingly scarce, and a quick look at any mortgage calculator shows why.

When Canadian variable rate mortgages were available at 1.65% from 2020 to early 2022, one was enabled to buy a $750,000 property with 20% down and a monthly payment of $2441 over a 25-year amortization. At a current rate of 6.14%, buying power is reduced by 38 percent with the same monthly payment enabling a maximum purchase price of $465,000.

To qualify for a CMHC-insured mortgage in Canada (less than 20 percent downpayment), one must qualify based on an interest rate of around 8.14%. At this rate assumption, the same $2400 monthly payment can qualify for a maximum purchase price of $340,000 (54% lower than in 2021). Sellers are in denial–the average Canadian home listing in August was $750,100 and well over $1 million in the highest population areas.

Similar math is evident in America, where a $1k monthly payment today can buy a home priced at $173,000, down 44% from $309,000 in 2020 (chart below courtesy of Jeff Weniger). At the end of June, the average US asking price was $416,100.The inverse correlation between mortgage rates and home sales is evident in the Visual Capitalist chart below since 2014–unsurprisingly, sales have tumbled to the lowest level in more than 20 years. As motivated sellers and lenders rise, steep discounts will be needed.

The liquidity Calvery is not riding to this rescue. The average time from the last Fed rate hike to the first cut has been ten months, with a range of four to eighteen months. Moreover, once they start, rate cuts, like rate hikes, will be felt throughout the economy at a 12 to 24-month lag. Those who need or want to sell are best to be proactive.
Posted in Main Page | Comments Off on Buying power has halved, do the math

Housing-led downturn to rival 2008

A decade of levered fiscal and monetary incentives has enabled yet another epic capital misallocation cycle.  Now, we are in the takeback period once more. Heads up.

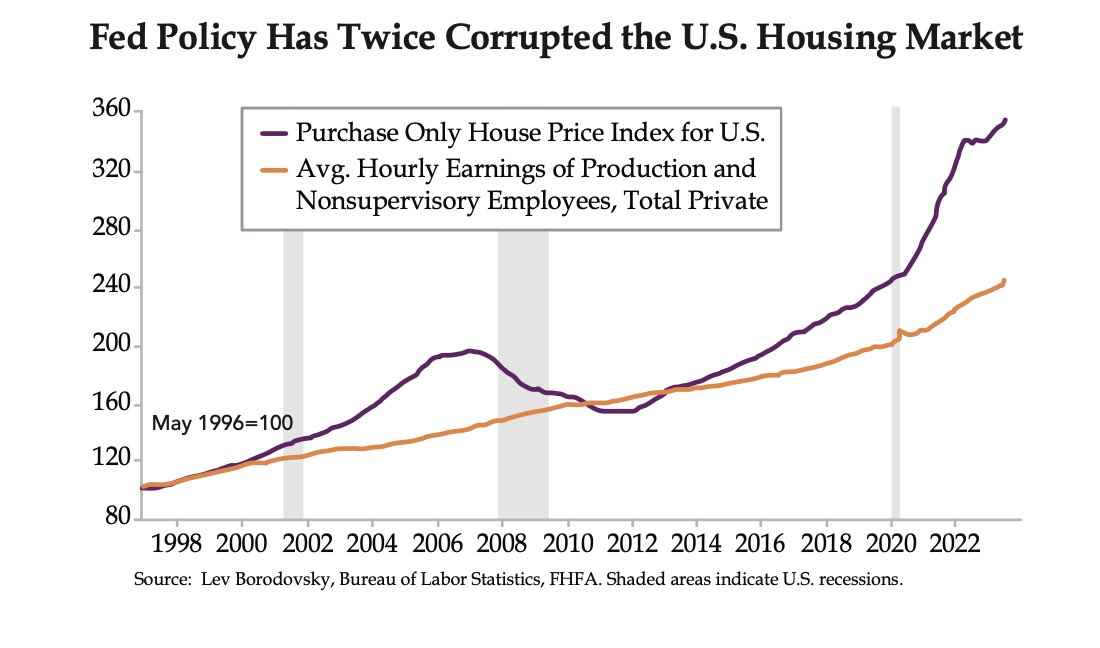
Housing-led economic downturns have historically been the most severe, and the price of homes (US in purple below since 1996) enters this downcycle more elevated relative to income (orange line) than at the 2006/07 bubble peak.
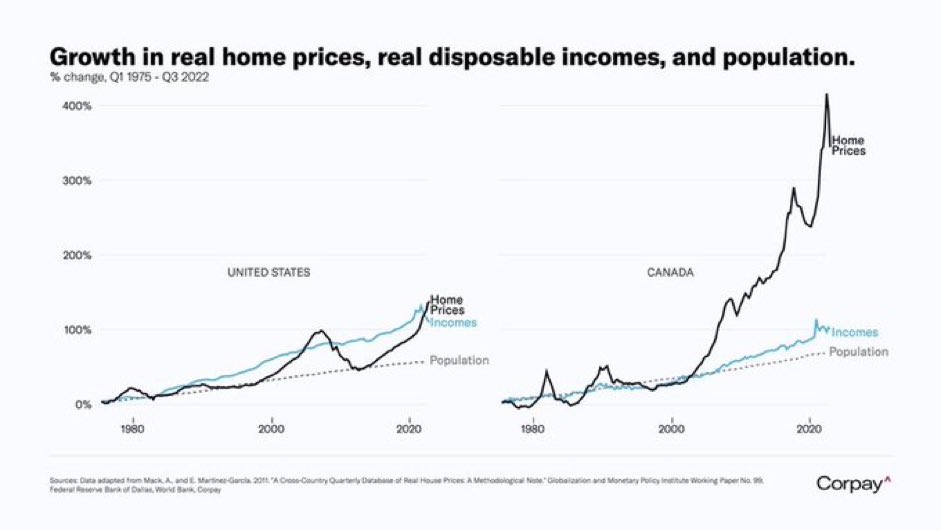
The price-to-income bubble in Canadian housing (lower right in black since 1975) is truly grotesque and much worse than in America (lower left). Population growth (shown in dotted lines for both countries) is neither the cause nor the solution from here.  The compounding cost of all this will become increasingly evident as prices mean-revert back in line with income.  #painful process. Motivated/desperate sellers are on the rise.

Who are you going to believe, all of the commissioned salespeople in the financial sector or facts and figures on the ground? See “We’re barely making it: Eight Canadians Reveal the Pain of Soaring Mortgage Costs and Consumers Starting to buckle for the first time in a decade, Former Walmart US CEO and China’s Golden Week Doesn’t Glitter: “Chinese consumers spent and travelled less during the holiday period that ended on Friday than the government had projected, figures showed, while home sales in key cities were weaker than last year.”

The segment below illuminates realty trends unfolding in America.

Housing market is poised for a major mortgage default (bigger than 2008), according to Mortgage Analyst, Melody Wright. Here is a direct video link.

You can see more in Zillow reports Big Price Cuts on Houses (Top 10 cities that are crashing).

Posted in Main Page | Comments Off on Housing-led downturn to rival 2008

Cooling wage growth and loss of full time jobs confirm weakening economy

Cooling Wage Growth Easing Inflation Worries — DiMartino Booth Joins Charles Payne of FBN. Here is a direct video link.

Posted in Main Page | Comments Off on Cooling wage growth and loss of full time jobs confirm weakening economy