Disinflation offers cause for pause

May’s US CPI at 4%–the lowest since March 2021–has increased the prospects of a Fed pause tomorrow; a July hike remains possible. But as I’ve pointed out for months, pauses are not bullish; historically, they’ve preceded the steepest part of economic and market downturns.

The good news for consumers (but not corporate profits) is that recessions are typically disinflationary and deflationary. The 19.3% drop in the price of critical commodities (CRB Index below) over the past year is headed in that direction. Further mean reversion is typical as rising unemployment crimps demand.

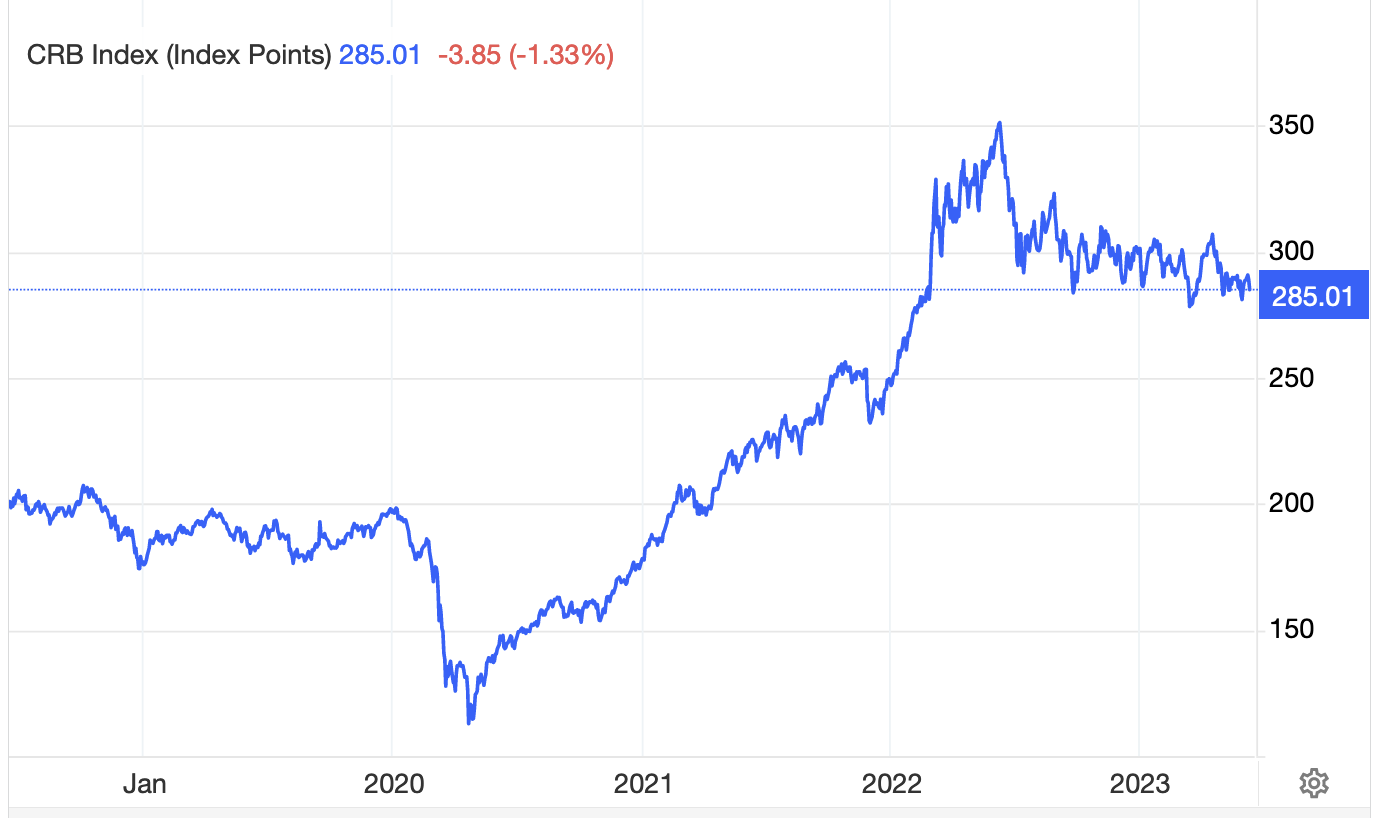
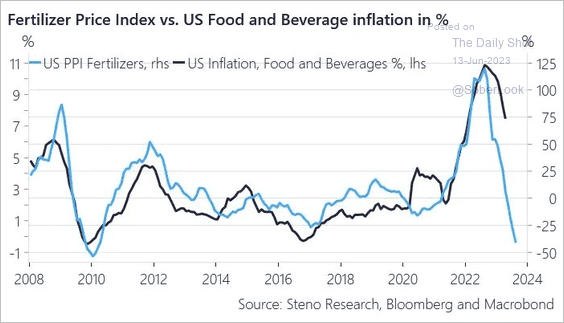
So far, from its 2022 peak, oil (WTI) is -44%, gasoline -20%, nickel -57%, copper -23%, aluminum -47%, and lumber -77%. Food inflation was still 5.8% year-over-year in May, but as shown below, since 2008 (via The DailyShot), fertilizer prices are leading food inflation lower into 2024—some much-needed relief for the masses.

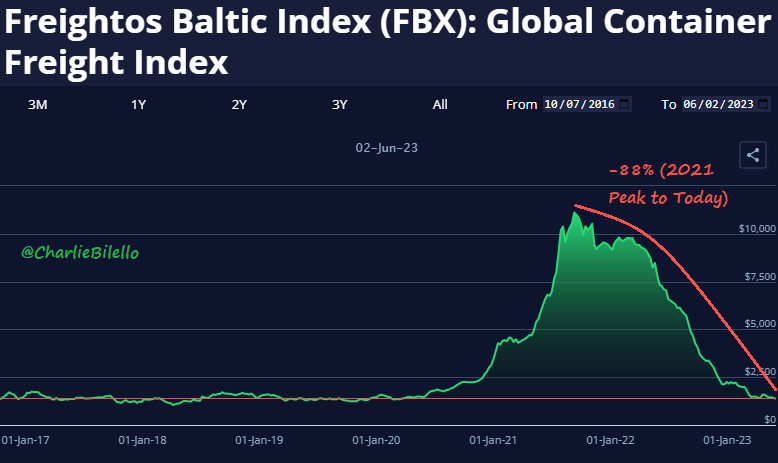
Further supporting disinflationary trends, shipping costs–the Baltic Global Container Freight Index–are -88% since 2021 (below since 2012 via Charlie Bilello) and have given back all of their COVID inflation.

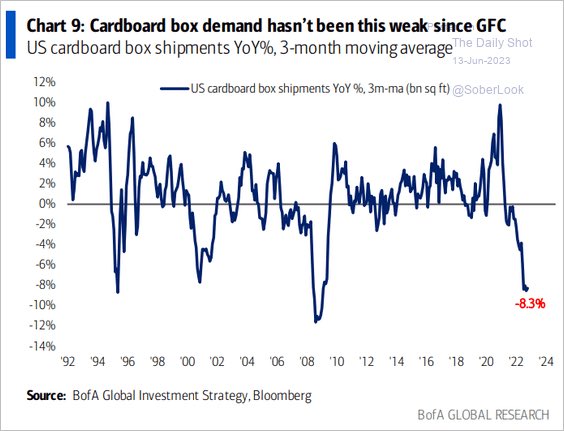
The 8.3% year-over-year decline in US cardboard box shipments is the steepest decline since the 2008 recession (shown below since 1992).

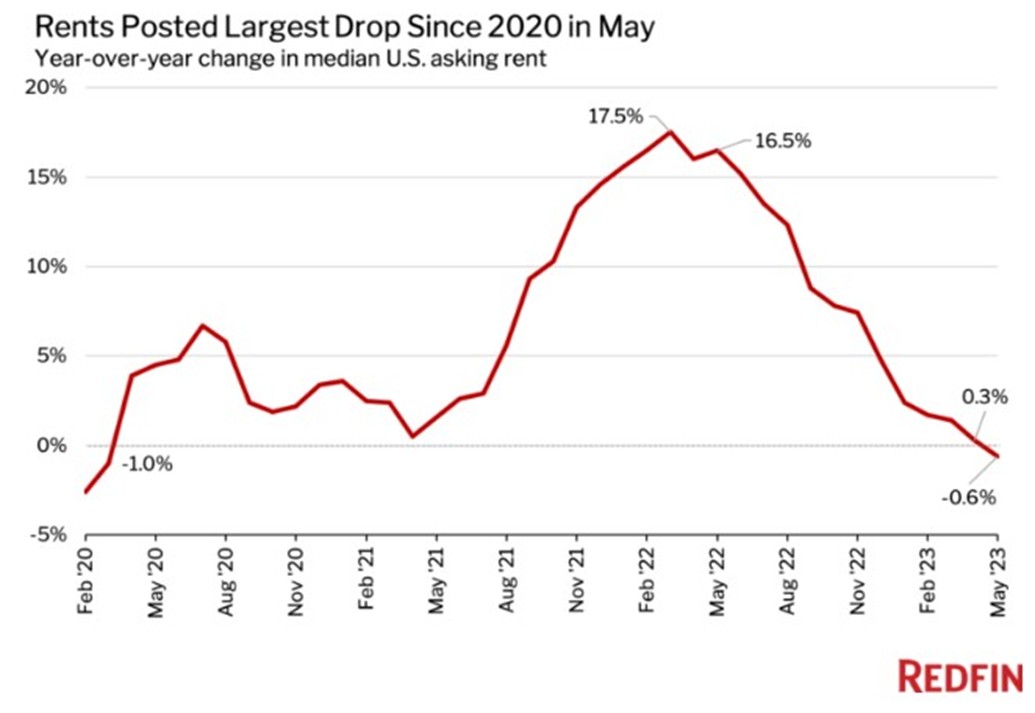
Housing costs continue to weigh on increasingly stressed households–a headwind for consumption-dependent economies. Most homes are presently unaffordable for the majority of would-be buyers and renters. That said, the cure for high prices is high prices, and wildly-inflated housing has earned an extended downcycle. As shown below, since 2020, the year-over-year drop in US median asking rents in May was the sharpest since 2020. More of this is needed–but moving in the right direction.

Posted in Main Page | Comments Off on Disinflation offers cause for pause

Full cycle bearings

The S&P 500 is up 11% YTD (below in brown); the Nasdaq nearly 33%; and the TSX is +2.5%. Under the hood, a 53% year-to-date average gain for the seven most expensive US tech companies has done the lifting (in green below since December 2022), while the other 493 S&P 500 companies (in orange) have gone nowhere. As shown below, the year-to-date market-weighted S&P 500 gain versus an equal-weighted basket is the most extreme since at least 1990.

Today, the eight most expensive tech stocks account for 30% of the S&P 500 market cap. At the March 2000 cycle peak, tech accounted for 34.8% of the index. Sixteen years and two brutal bear markets later, the sector had shrunk to 20% of the S&P market cap.

As shown below by my partner Cory Venable, the S&P 500’s 51% drop through October 2022 saw a series of sharp rebounds, including one from June to September 2000 that nearly reclaimed the March 200o top.

Sentiment and stock allocations among participants are back near record highs. The S&P 500 has rebounded within 10% of its December 2021 peak, and there’s excited talk that a new bull market has begun. History warns that we’ve not nearly earned that yet.

Posted in Main Page | Comments Off on Full cycle bearings

Technology enabling brighter future

With Canada battling horrible forest fires, there is good news: we have solutions to stop compounding the harm. Along with sending well wishes and support to those directly impacted, individuals are each called to evolve and help lead the change. Keeping ourselves apprised of rapidly advancing technology is a first step. The clips below help.

Tony Seba was right – solar is creating the fastest energy change in history.

In Episode 5 of our ‘Brighter’ series, RethinkX Director of Research Adam Dorr describes why understanding technology disruptions is so important and how “the world’s most authoritative sources” of energy projections have gotten things so wrong, and why it matters for the future of the environment and climate change.

Posted in Main Page | Comments Off on Technology enabling brighter future