Whether calories, investment or spending, we can’t make intelligent planning and management choices unless we have accurate numbers; this means that transparent content labelling is essential, and we must overcome all those who oppose it.
To stay within needed limits on greenhouse gas and other pollution emissions, we need to define our maximum budget per capita and then look for the choices that allow us to stay within that budget. In one crucial step toward self-preservation, carbon labelling is coming to grocery products in 2022, and the requirement is needed in all sectors.
It’s pretty straightforward: A product’s climate footprint is the calculable impact on the environment from making it, expressed through carbon dioxide equivalents (CO₂e), the measure used by the United Nations Framework Convention on Climate Change and the European Commission. See, You’ll see more carbon labels in the grocery store next year. Here’s what they mean:
If Canada were to meet goals set out by the government in December 2020, that would mean a national CO₂e output of 503 megatonnes by 2030. And a megatonne, as everybody knows, is equal to 1,000,000,000 (one billion) kilos. Say you divide Canada’s 503,000,000,000 kg of CO₂e by our projected 2030 population of 44,000,000. That would give you a carbon footprint of approximately 11 tonnes of CO₂e per year per Canadian, or 31 kg of CO₂e per day. So if you chugged a 1 kg carton of Oatly, that would account for 0.31 kg or one percent of your daily CO₂e allotment. However, without similar data for all the other choices you make, the number isn’t that meaningful.

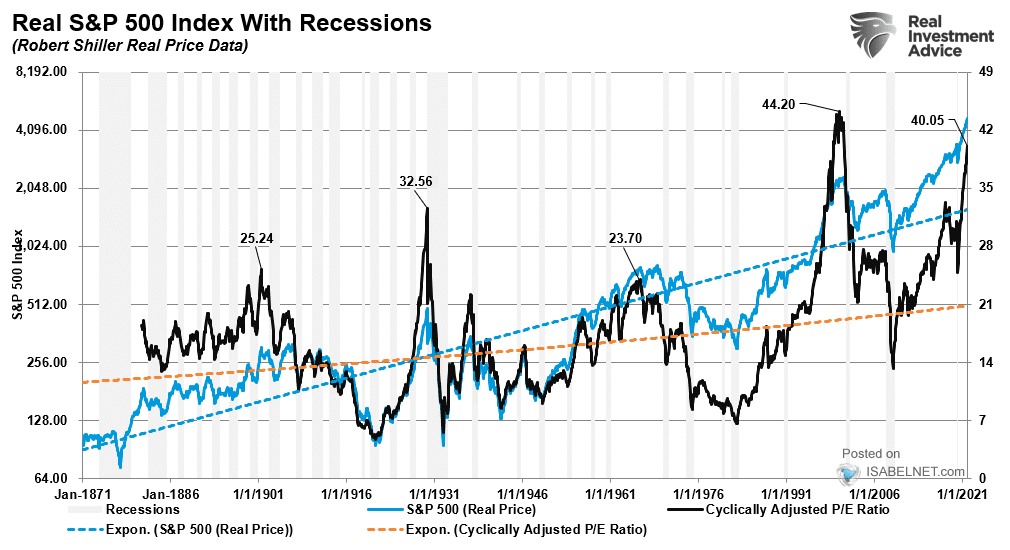
 The broader S&P 500 Index below in blue since 1870 is, meanwhile, sporting a Shiller (10 year smoothed) PE ratio of 40 (in black), second only to a fleeting 44 at the 2000 top.