Hoisington Q4 Review and Outlook

Hoisington Investment Management has published a Fourth Quarter 2019 Review and Outlook here, and, as usual, it’s worth reading.  Here are some key takeaways:

    • The U.S. 30-year Treasury bond yield of 2.39% on December 31, 2019, was the lowest yearly close on the 30-year since its inception in 1977, and the annual average yield for long term Treasuries of 2.5% was the second-lowest since 1950.
    • Low yields reflect U.S. economic performance that was substantially below expectations in 2019 and consistent with slowing global trends entering 2020.  India, Korea, Singapore and Canada are also exhibiting considerable frailty.
    • Real yields were more negative in Japan, the euro area and the U.K. than in the U.S.
    • The decline in U.S. yields happened amid a large tax cut and increase in Federal spending in 2018 and 2019 that was financed by debt.
    • Historical research confirms that the U.S. economy loses 1/3rd of its trend economic growth rate when government debt rises above 90% for five years–the U.S. has met that condition since 2014.
    • At the same time, US corporate debt surged to a record 47% of GDP in Q3 2019, 3% above the peak in this ratio in the 2008-09 financial crisis.  Total business debt, which includes unincorporated firms, surged to a record 75% of GDP in Q3.
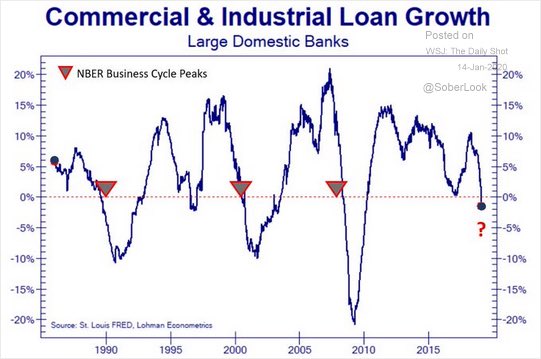
    • In the second half of 2019, the growth rate in bank loans and leases decelerated and the two-year annualized growth rate in M2 money supply decreased to a fourteen year low.  The decline in bank loans has been a reliable cyclical indicator just prior to all recessions since 1950 (see @SoberLook’s chart below since 1980).
    • Although corporate profits after-tax rose $163 billion in the 8 years between 2012 and Q3 2019, the before-tax gain was just $53 billion.  The tax cut accounted for 2/3rds of the rise in corporate profits, and in real terms U.S. average corporate profits have declined since 2012.
    • The stagnation in profits is reflected in the drop in real capital spending and new orders.
    • The total industrial capacity of the U.S. manufacturing, mining and utility companies was 77.3% in November, lower than the peak reached a year earlier and lower than the level at which the economy entered all recessions since 1970.
    • Recent OECD data shows that industrial sector capacity has moved steadily lower for all OECD countries over the past 5 years, and confirms that global manufacturing is in a recession.
    • The loss of economic momentum, high debt levels, flat profits and excess capacity will continue to bring slower growth, subdued inflation and lower Treasury yields in 2020.

On the topic of corporate loan growth, here is a chart from @SoberLook showing Commercial and Industrial loan growth at large US banks since 1980, with past NBER economic cycle peaks marked by red upside down triangles.
Posted in Main Page | Comments Off on Hoisington Q4 Review and Outlook

Real Vision: The economic undercurrent of a rallying stock market

Worthwhile discussion in this segment.

Keith McCullough, CEO of Hedgeye Risk Management, shares his macro perspective with Real Vision founder and CEO Raoul Pal in this wide-ranging discussion on investing in a perplexing market environment. They try to make sense of a buoyant stock market that seemingly contradicts the ominous economic indicators that ought to be curbing the market’s growth. Keith explains his bearish outlook on China, while Raoul contends that widening credit spreads in the U.S. indicate that a market correction could be in order.  Here is a direct video link.

Posted in Main Page | Comments Off on Real Vision: The economic undercurrent of a rallying stock market

Return prospects are priced in whether we accept them or not

Every so often I receive angry messages from blog readers who insist I am wrong to be bearish of stocks and corporate bonds.  My first point would be, no one has to read my thoughts.  If one is confident in their own investment rules and assessments, they should be content to follow them and make their own management decisions.  Sending angry messages to me is a complete waste of time.

Second, I am a fundamental financial analyst, and my partner a technical analyst, and the ruleset we adopted when we founded our asset management firm is fundamentally and technically based and drawn from 200 years of historical analysis, and 30 years of live experience as money managers. We don’t change our rules when our measurements signal negative investment prospects, and, no, prospects do not get better the more over-valued assets become–quite the opposite.

No approach gets to outperform through every phase of each investment cycle so thinking people must accept that.   We exercise allocation discipline and are not able to buy assets that measure as egregiously overvalued because doing so knowingly is negligent and highly likely to end in financial losses for ourselves and the clients who trust us with their life savings.  Again, being angry with us for doing the job we are trained and hired to do, makes no sense.

Facts will be faced one way and another, and reality exists whether we acknowledge it or not.  If we have no meaningful investment rules or restrictions, then we are straight-up gamblers, and the house will eventually take our money; believing or hoping otherwise is illogical.

We have all lived through a record asset price expansion cycle since 2009, and that makes return prospects over the next decade much worse not better–accept this truth, or not.

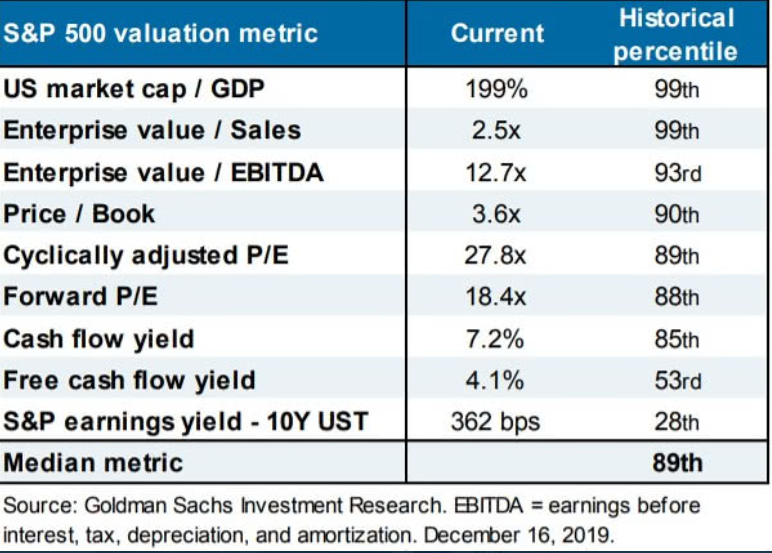
This table of historically relevant valuation metrics for S&P 500 stocks speaks for itself.  The first seven ratios average in the rarified 85 to 99th percentile of historical incidents, and the last two register in the lower half and third of historical yields (because prices are so high).

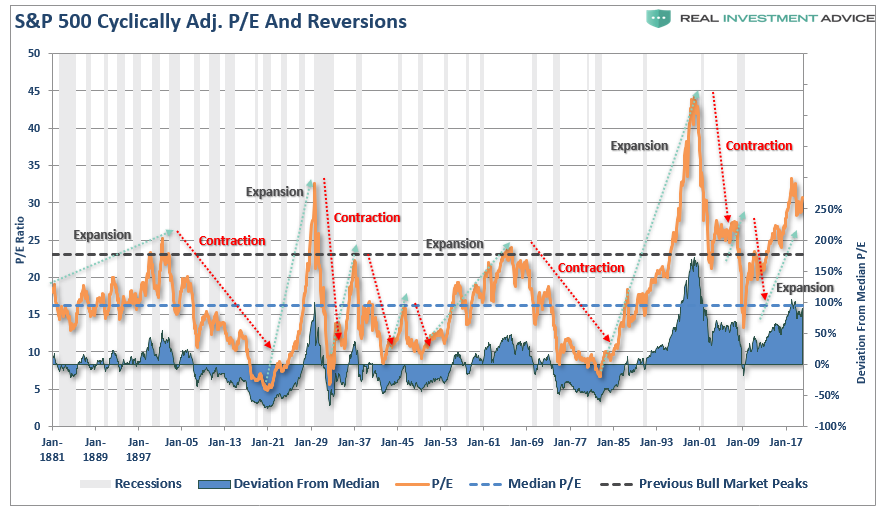
The next chart plots the price to cyclically adjusted backward-looking earnings expansion and contraction cycles in US stocks since 1881. Here, we can see that the current multiple expansion cycle matches 1921 to 1929 and is second only to the 1982 to 2000 expansion.  In addition, we can see that every single expansion cycle has been followed by a contraction cycle of similar magnitude, which corrected valuations from above the long term mean to well below it–hence restoring the long term mean.  It’s just the way it works.

In terms of price to sales, shown here since 1990, we can see that the current expansion (in red) has surpassed the previous all-time bubble peak of 2000, even as it remains below the delirious price to forward estimated earnings top of 2000 (in black), whereafter stocks tanked and spent a decade trying to make back losses.

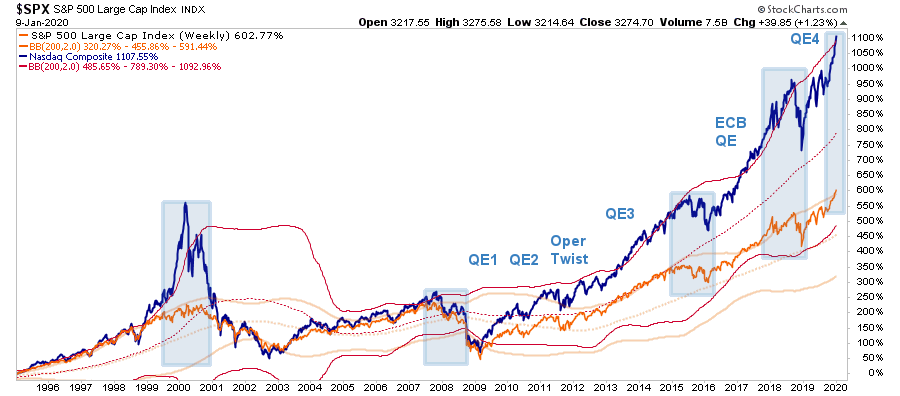
In the final chart below, we can see that the tech-heavy NASDAQ (in blue) has outperformed the S&P (in orange) this cycle, by even more than the tech bubble of 1998 to 2ooo.  As Lance Roberts points out today, both markets are now trading more than 3-standard deviations above their 200-week moving averages, in one of just four other such extreme and short-lived occurrences of the past 25 years (blue boxes).

Meanwhile, present holders face massive downside, most with little ability to tolerate losses or even modest returns going forward.

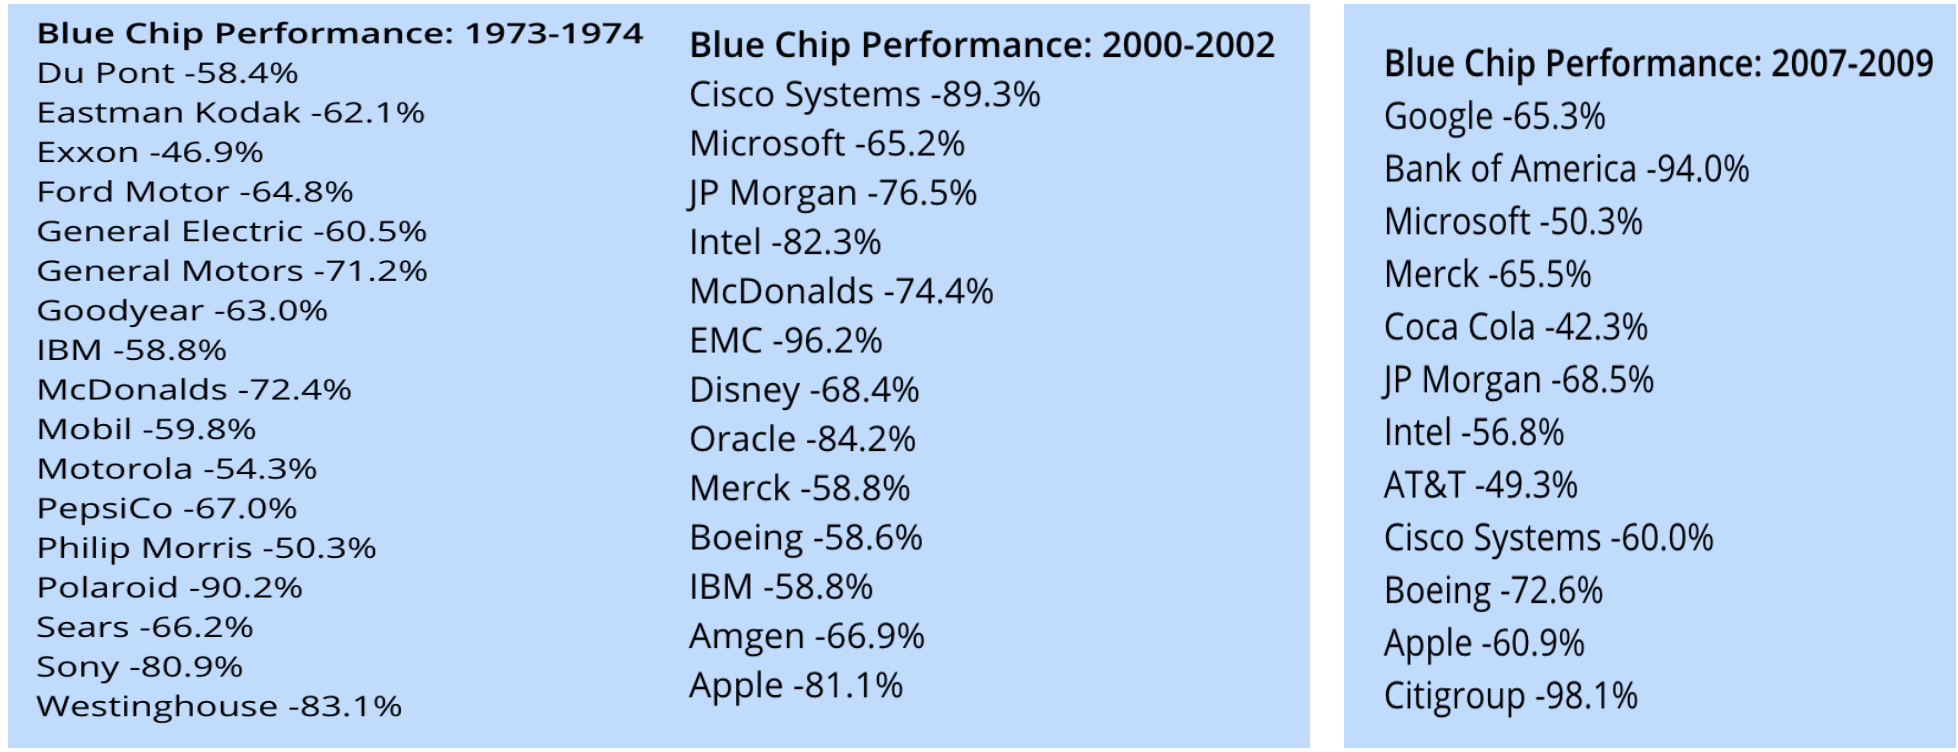
Last month, John Hussman offered the following performance summary of the most widely held ‘blue-chip’ stocks following the three most comparable valuation extremes in history.  Holding funds, ETFs or managed accounts of them is not defensive.

“The delusion was that these companies were so good that it didn’t matter what you paid for them; their inexorable growth would bail you out.” – Forbes Magazine, 1977, The Nifty Fifty Revisited

This the reality currently priced into stocks; denial is no antidote.  As they say in the casinos, “Know your limit, play within it.”

Posted in Main Page | Comments Off on Return prospects are priced in whether we accept them or not