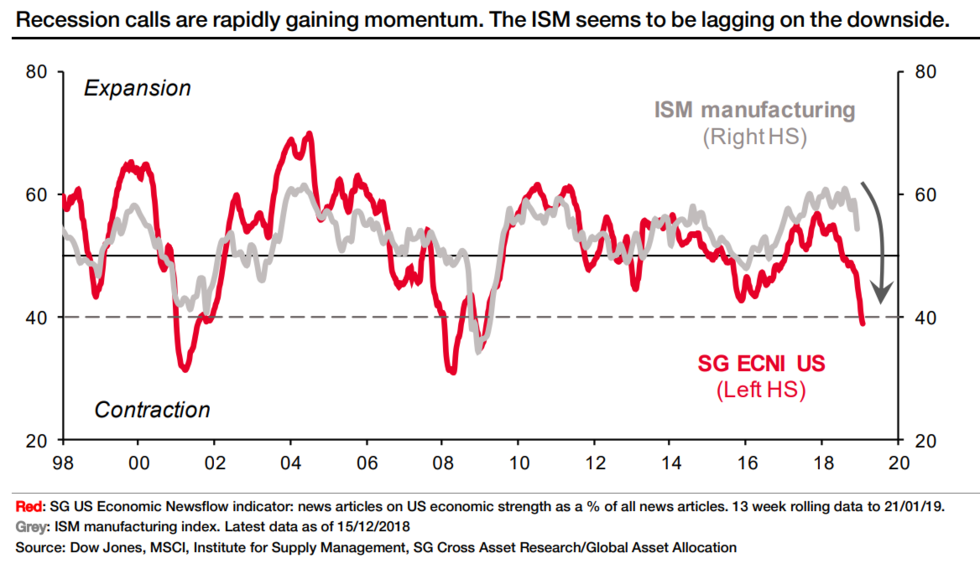
The global stock market drop in the third quarter of 2018 was sharp and quick. In North America, the S&P 500 and TSX 60 fell 18 and 15 percent respectively in just 60 trading days between October 1 and December 24th. Both then rebounded some 14% in the 25 and 28 trading days that followed into the first week of February. Abrupt legs down are typical of cyclical bear markets, but even so, the Q3 decline in 2018 was a standout, as noted last month by GMO, Jan 2019:
“…The change in mean reversion speed from the third to the fourth quarters of 2018 eclipses that of 1929, highlighting just how dramatic the last few months have been. The magnitude of the move also tilts the odds in favor of the view that we may currently be experiencing the initial stages of the bursting of the bubble in 2017-18.”
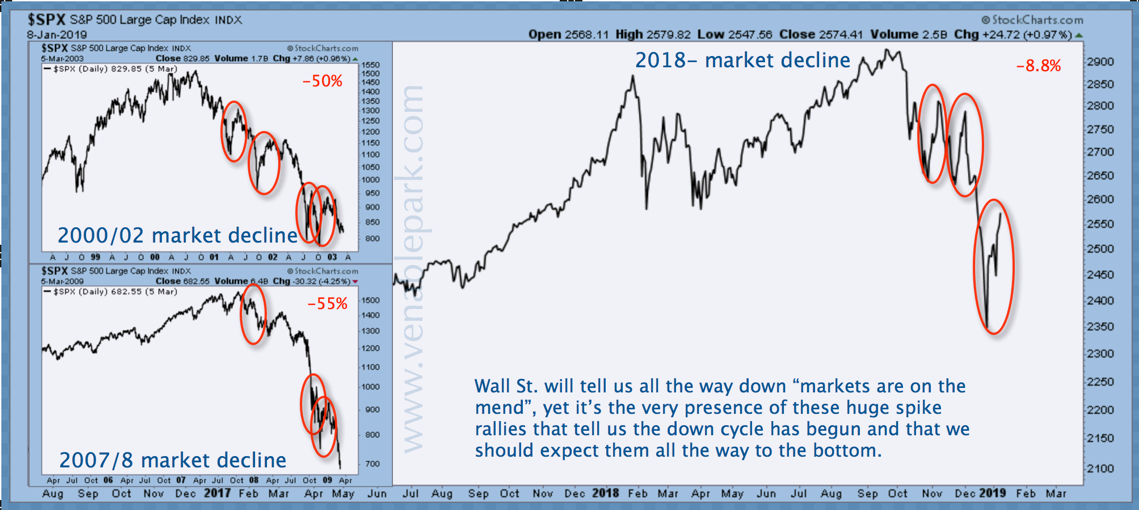
The last two major market downturns were also punctuated by a series of dramatic drops and pops beginnin g in 2000 and 2007 as shown beside courtesy of @oddstats, although the recent decline was faster than usual.
With market participants coming into this downturn more levered than ever before in history, accelerated moves in both directions can be expected as margin calls force a cascade of selling and short squeezes a frenzy of buying back shares.
My partner Cory Venable offers another view of the drops and counter-trend rallies for the S&P 500 into January on the lower right (circled in red), and those within the -50% bear markets of 2000-02 and 2007-09 on the lower left.
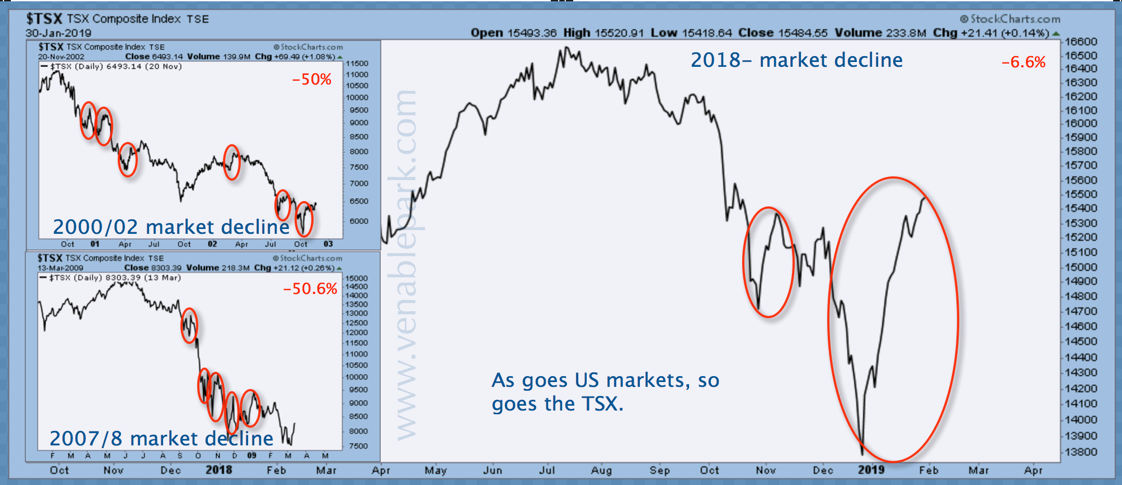
Here is the same view of Canada’s TSX 60 index.
While it can be easy to get psychologically swamped by the near-term crests and swales of fast-moving financial markets, Cory’s chart below of the S&P 500 since January 2017 offers some larger cycle food for thought. On January 15 the 2700 area was a plausible rebound target from the short-term oversold lows of late December. On February 1 the S&P 500 hit 2685 and turned down.
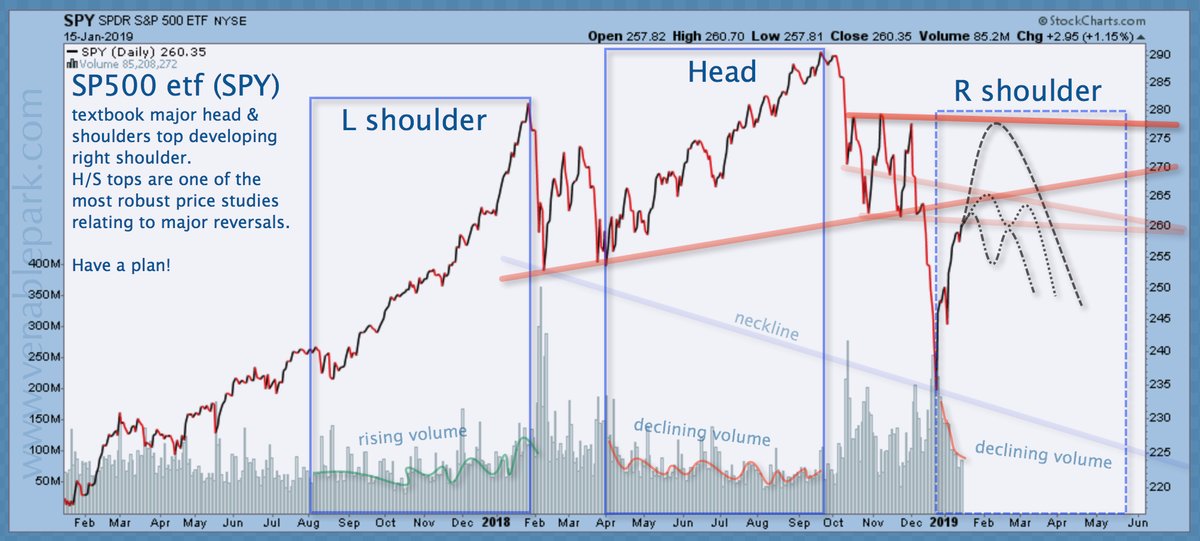 Price could certainly bounce around in this area for some time, but a failure to break through resistance (top red line) is further confirmation that the market decline that began so violently in Q4 of 2018, is the much-delayed third bear cycle of the secular bear that began in March 2000, nineteen long years ago.
While unprecedented central bank injections and reckless risk-taking on ludicrous leverage have certainly served to stall the inevitable mean reversion process this cycle, they have also made this bear more potentially vicious and dangerous than average for those holding corporate securities.
For those who are out of corporate securities and armed with cash, patience and a plan, once-in-a-decade investment opportunities are due on deck in the months ahead.