
Danielle was a guest with Jim Goddard on Talk Digital Network talking about recent developments in the world economy and markets. You can listen to an audio clip of the segment here.
Follow






_________________________
Danielle was a guest with Jim Goddard on Talk Digital Network talking about recent developments in the world economy and markets. You can listen to an audio clip of the segment here.
The fact that the US Fed has determined that real rates above 0.5% are a threat to both economic growth and 2% inflation, suggests the economy is not ‘in a good place’ but extremely fragile. Here is a direct video link.
Fed Chairman Jerome Powell said in prepared remarks that the central bank would use its monetary policy tools to keep the U.S. economy in a good place. Mr. Powell spoke at a news conference following the bank’s decision to keep its benchmark interest rate steady.
Perhaps the steady stream of historically informative indicators (such as the below spread between present situation consumer confidence and future expectations), suggesting recession and financial market shocks on deck, have caught their attention. 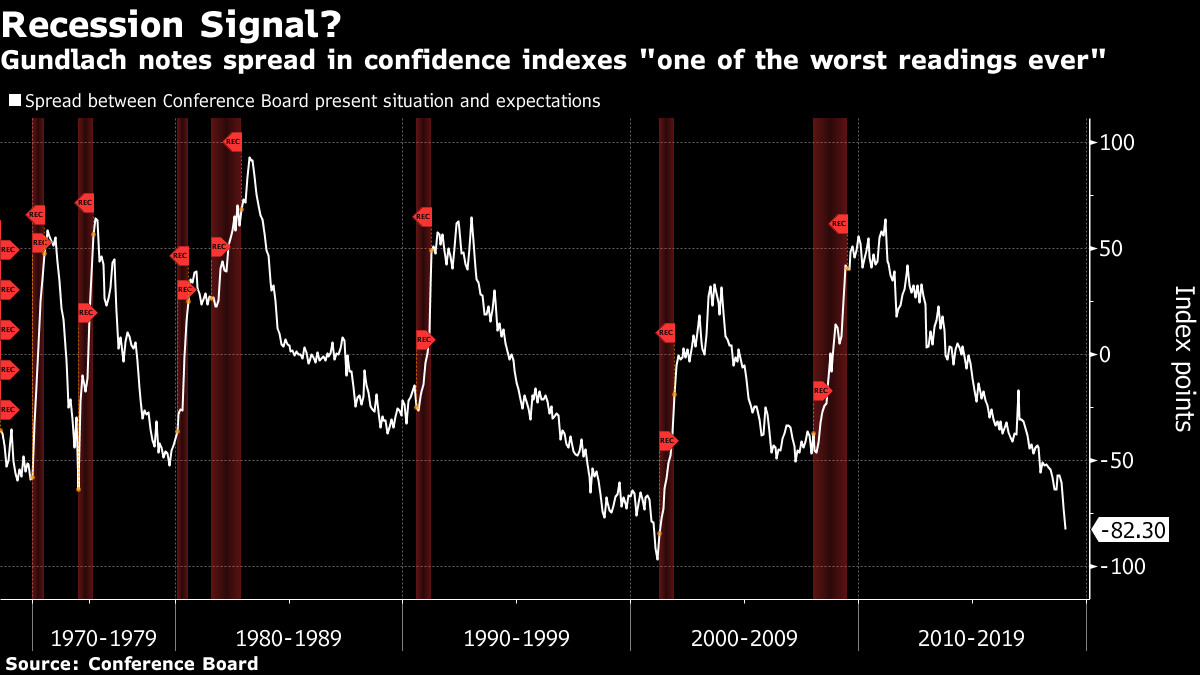
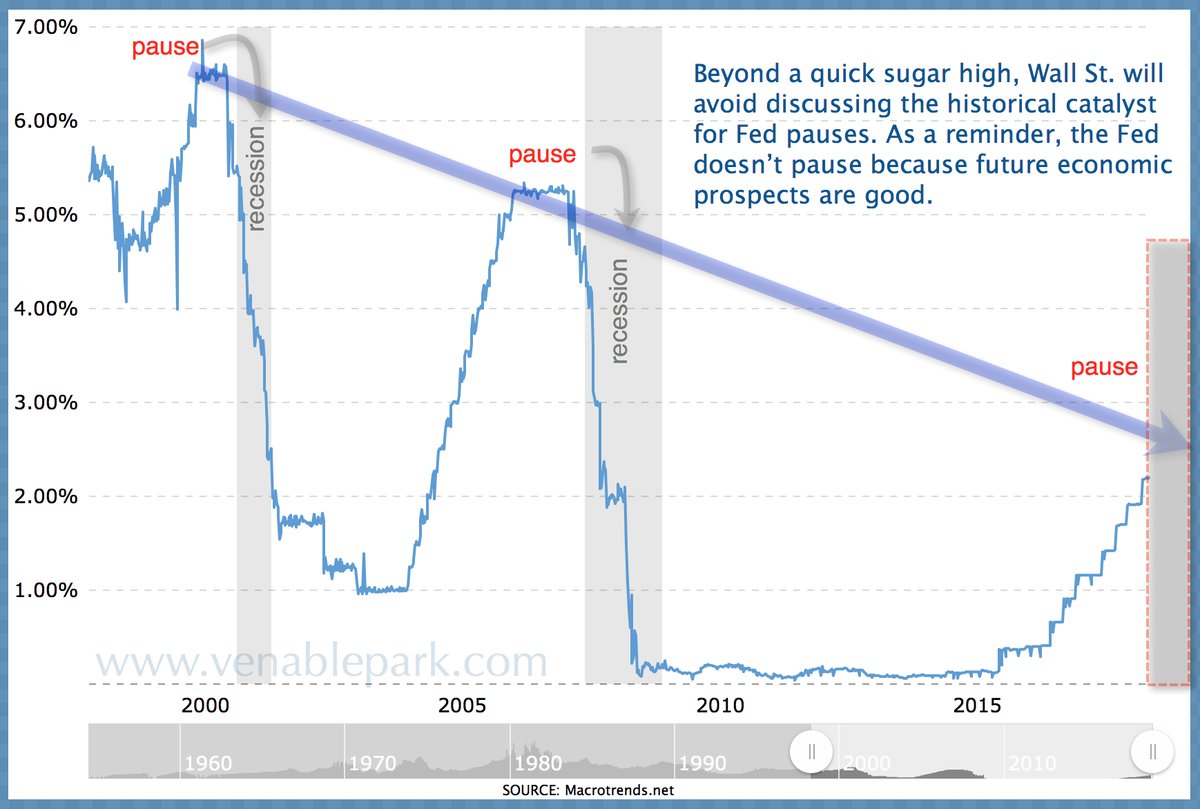
Lest anyone think the Fed’s pause yesterday is a bullish sign, this chart of the Fed funds rate since 1995, highlights that past pauses have preceded recessions not expansions.
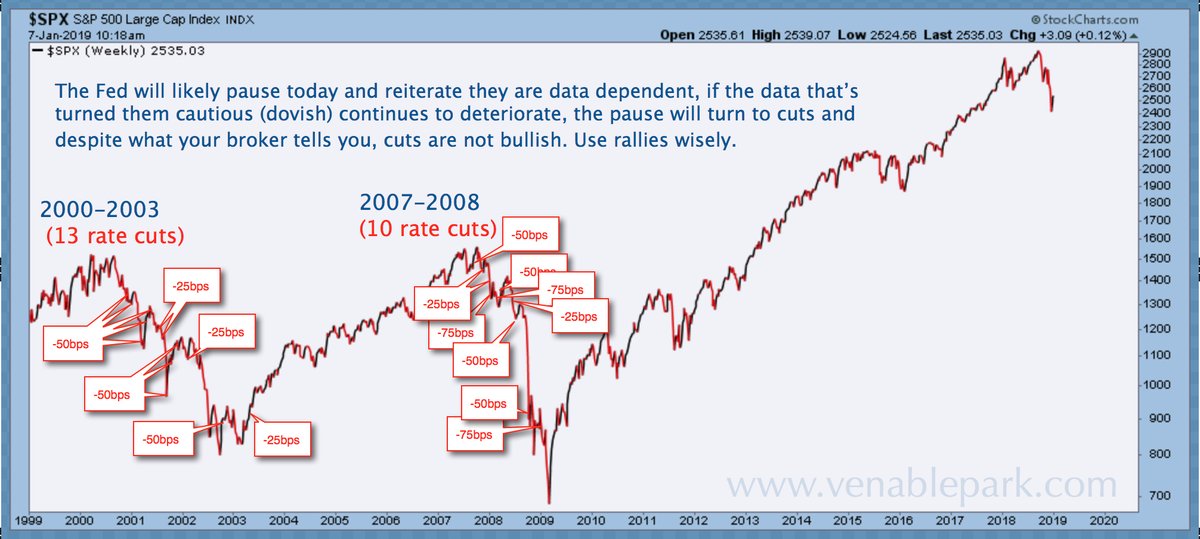
And yes, as shown below with the S&P 500, central banks switch to cutting rates and injecting liquidity as downturns worsen, and they will do the same this cycle, no doubt. However, this has never stopped bear markets and recessions from happening, and this time they meet the correction phase already holding several trillion in assets from the last crisis, and with 2 not 5% of rate-cutting room to deploy. Banking on miracles is not an investment strategy.
As risk markets have recovered some of their dramatic third quarter sell-off this month, shares of semiconductor makers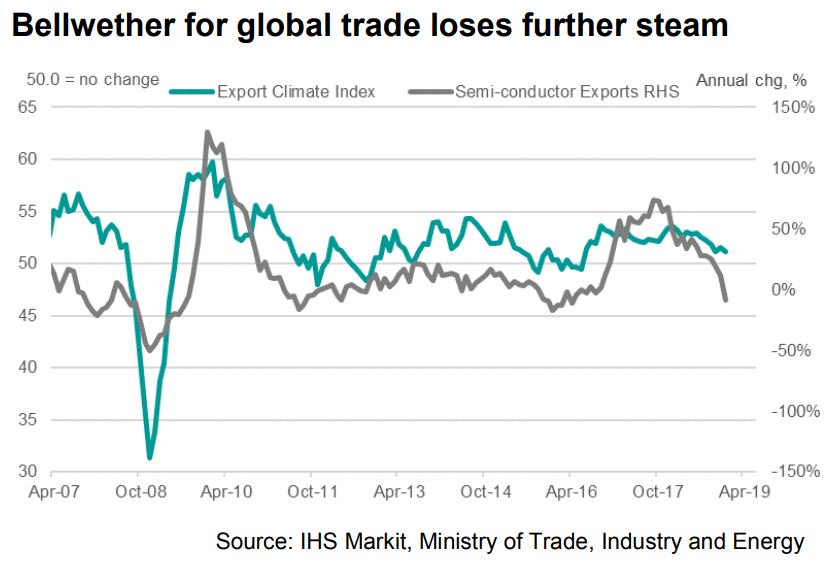 have bounced along for the ride, even as semiconductor exports out of South Korea have fallen 28.8% on a year over year basis.
Because semiconductors are used in a wide range of manufactured goods globally, demand for them (grey line beside) is seen as a bellwether for world trade (green line beside since 2007).
The PHLX Semiconductor Sector Index (SOX) is a modified market capitalization-weighted index of share prices for the top 30 companies primarily involved in the design, distribution, manufacture, and sale of semiconductors globally.
My partner Cory Venable’s chart of the SOX Index below shows the tech wreck peak for this sector in March 2000 followed by the 80% loss into September 2002; the cyclical recovery into July 2007 followed by the 67% loss into November 2008; the cyclical recovery into March 2011, and the ‘free-money’ extension on QE and Trump’s corporate tax cuts into March 2018.
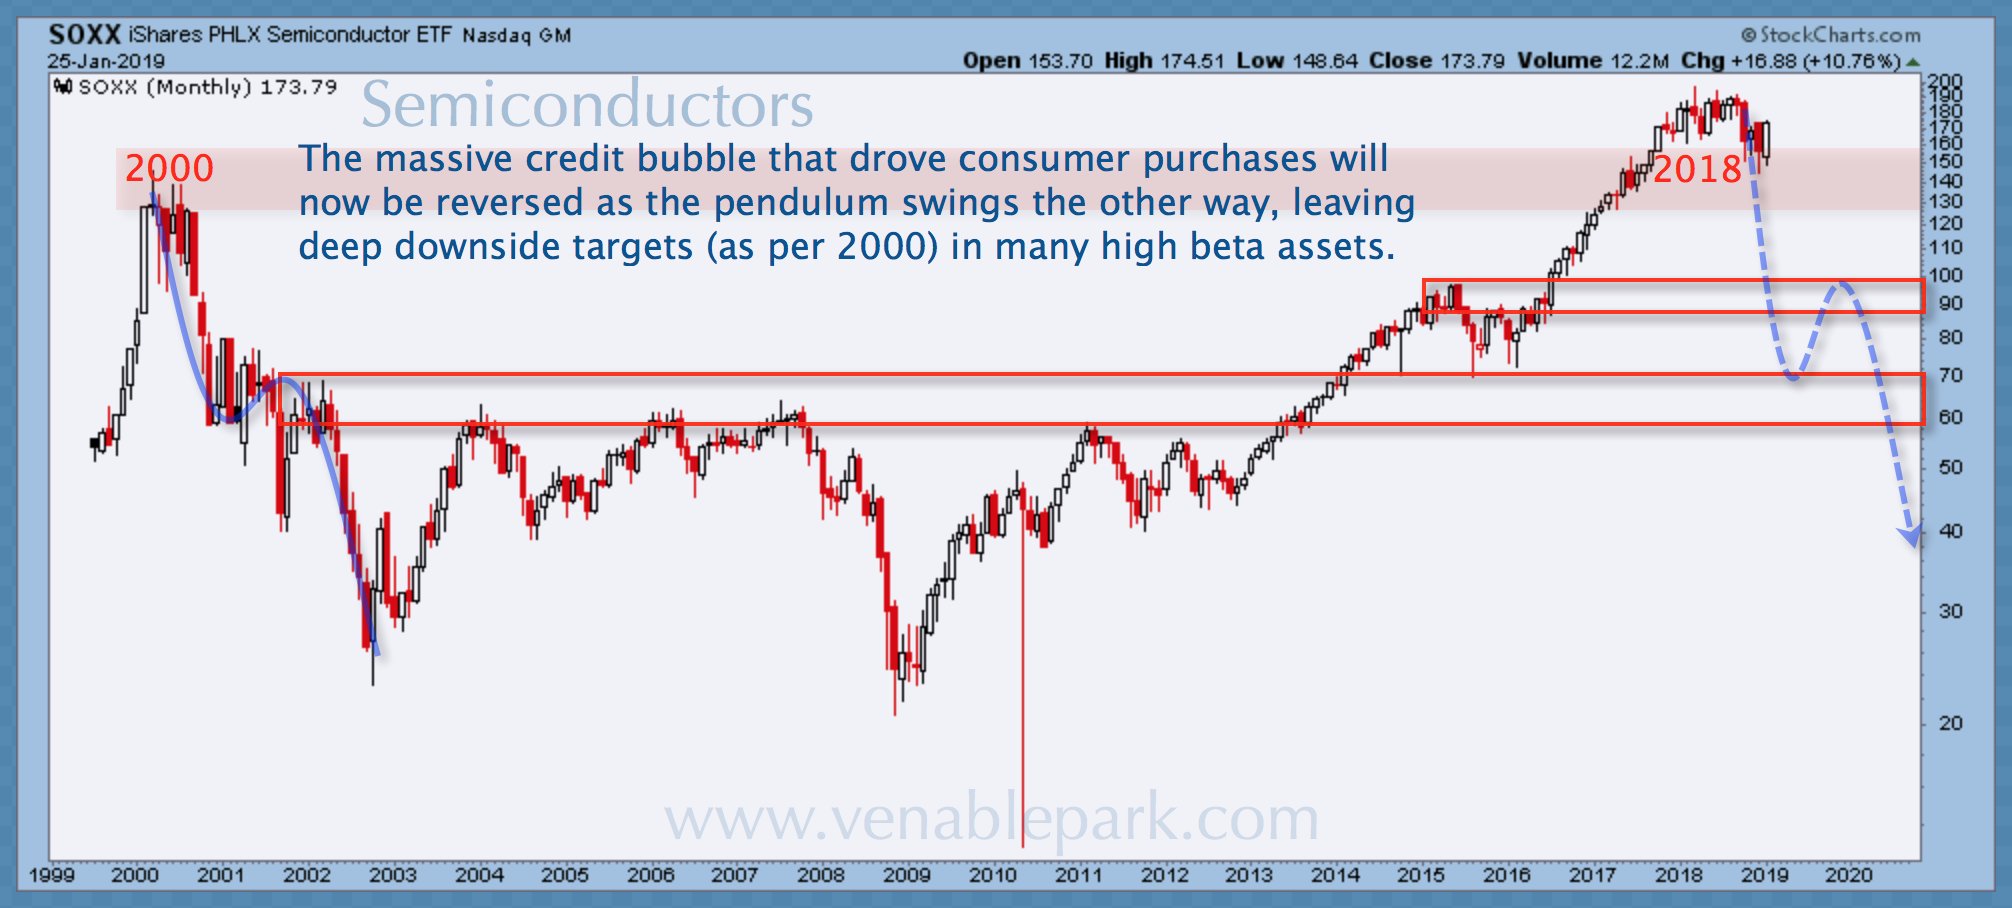
Despite the counter-trend bounce this month, the sector remains -13.3% from its March peak as of yesterday’s close, and a downside target in the $40 range (80% from the 2018 high) remains likely in the months ahead, as the third market cycle since 2000 completes.
In an Investor’s Digest article in May 2009 available here, I pointed out that demand for semiconductor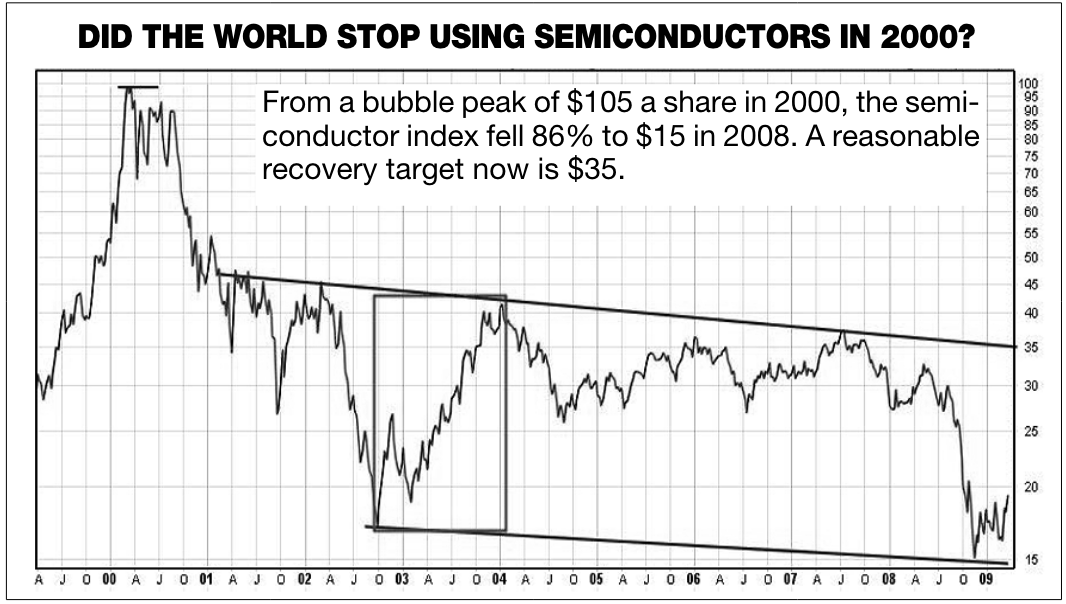 s did not end in 2000 as prices plunged, but shares that become exuberantly over-valued need to be sold and avoided so they can be bought near cycle lows if investors are to benefit from owning them:
World demand for semiconductors did not end in 2000. It has been growing ever since. A recent KPMG report estimates that global semiconductor sales will reach $260 billion in 2009, up from $213 billion in 2004. Although very cyclical, the 20-year average annual growth rate for this sector has been 13 per cent. Yet the aftermath of the 2000 tech bubble was not kind to semiconductor investors. After a bubble peak of $105 a share in 2000, the semiconductor index(SMH) deflated more than 80 percent into late 2002. It recovered 130 per cent from 2002-2004 (see box in SMH chart above) and then dropped 57 per cent to $15 a share in the bear market of 2008.From current levels it is probable that this index could climb back to the $35 area again in the next cyclical expansion. Returns of 130 per cent are excellent over four-five-year market cycle — but only if we buy low and then sell again to capture the gains. For those who held and did not sell near the peaks of 2000 and 2007, reclaiming $35 a few years from now, will amount to negative real returns for years of heart-thumping holding in this “growth” sector.
Having sold and avoided semiconductors and other corporate securities in the 2006-08 market peak (which caused some clients to fire us for being out), my firm VPIC began buying them again in the spring of 2009 after prices had fallen back to 12-year lows and previously bullish-market gurus and investors were hiding under desks.
In our February 28, 2009 client letter here, we explained, “Before rabid bears tear at our flesh, we are compelled to highlight some bullish thoughts that seem presently overlooked…”. Unfortunately, a few clients then fired us for buying equities in the spring of 2009, because negative news had convinced them that doing so was too risky, just as capital risk was the lowest and yields the highest they had been in years.
We can anticipate these cycles and devise objective investment rules to benefit from them, but it requires personal discipline and independent thinking to steer clear of the madness of crowds today, as always.



