The valuation cycle strikes back

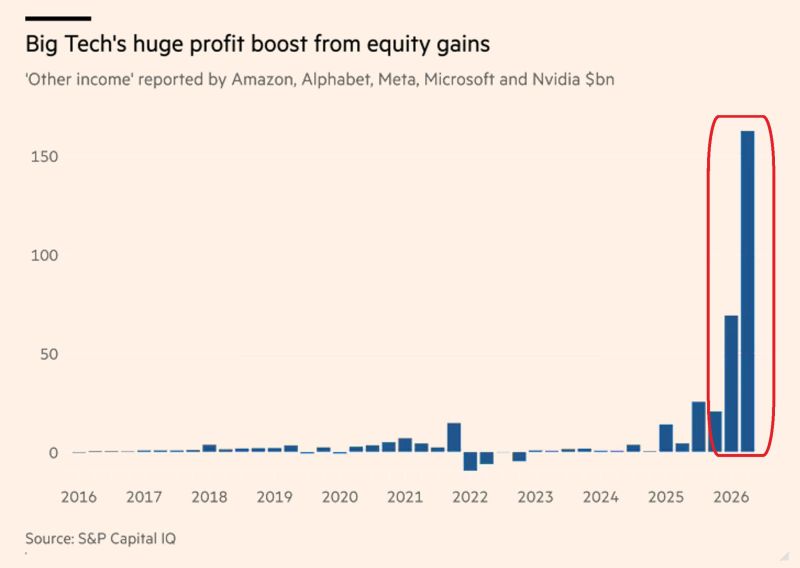
In the final stages of every market cycle, asset classes that have gone up on excess liquidity, leverage and speculative fervor, come down together all around the world.  As screens of red in global financial markets attest this week, historic correlations remain alive and well today; probably never more so. Yes, cryptocurrencies too.  Portfolio diversity foiled (thanks central banks!).
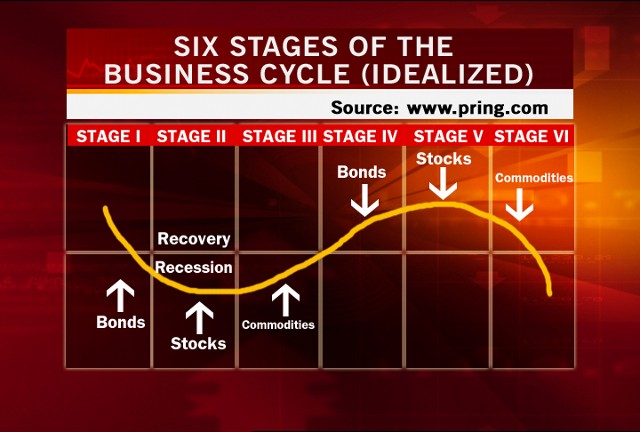
Moreover, this particular expansion cycle since 2009, now has the distinction of being the most over-inflated in history.  As explained and numerically demonstrated by John Hussman this week in Measuring the Bubble:

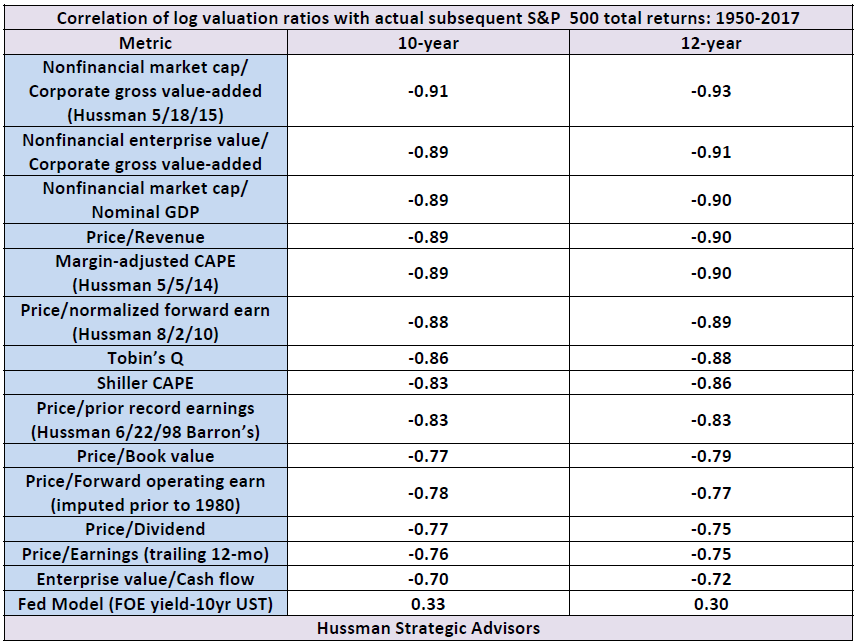
“Last week, the US equity market climbed to the steepest valuation level in history, based on the valuation measures most highly correlated with actual subsequent S&P 500 10-12 year total returns, across a century of market cycles. These measures include the S&P 500 price/revenue ratio, the Margin-adjusted CAPE (our more reliable variant of Robert Shiller’s cyclically-adjusted P/E), and MarketCap/GVA – the ratio of nonfinancial market capitalization to corporate gross value-added, including estimated foreign revenues – which is easily the most reliable valuation measure we’ve ever created or tested, among scores of alternatives… now stands beyond even the 2000 market extreme.

Hussman offers a user-friendly table of the 14 most historically reliable stock valuation measurements and their formidable (70-93%) negative correlation with S&P 500 returns over the following 10 and 12 year periods.  The bottom entry is the so-called ‘Fed Model’ ratio which has a positively useless +.33 correlation with subsequent market returns (no wonder central banks never see downturns coming, they are paid to look at the wrong measurements, literally.)


For all the people who are either ignorant about the significance of valuation cycles or have convinced themselves that they no longer matter in the brave new world of record leverage and speculation,  the coming mean reversion will offer yet another teaching moment.

With the most reliable stock valuation measures now 300% above long-term averages, the depth of mean reversion coming is already ‘priced in’ with a loss cycle likely to be larger than the 50% declines of both 2000-02 and 2008-09.  Believe it or not. This matters, because for all the record rebound in US stocks since 2009, a 60% decline would wipe out every bit of fantasy ‘total return’ (see Fun with S&P 500 snakes and ladders) since December 1999.

That’s how secular bears fulfill their extreme valuation destiny of 18-20 years with wild swings and zero net returns.  And with stocks back at the same and worse valuation extremes as in 1999, they are once more priced to spend the next 10-12 years with negative returns; longer still trying to grow capital back to present levels.  For those needing to take income withdrawals to live over the next couple of decades, the compound loss numbers from here will be much worse.  The time to take defensive action is before the downcycle begins.


Posted in Main Page | Comments Off on The valuation cycle strikes back

Danielle on This Week in Money

Danielle was a guest on This Week in Money with Jim Goddard, talking about recent developments in the world economy and markets.  You can listen to an audio clip of the segment here.

Posted in Main Page | Comments Off on Danielle on This Week in Money

Fun with S&P 500 snakes and ladders

Investment sales firms like to point to multi-decade charts of smooth upward-sloping return lines as a way to forecast compound returns ad infinitum.  Except, I don’t have a time horizon of infinity, and neither do you.  In real life, credit driven contraction cycles and the math of loss are recurring snakes that define the return game for mortals.  And since most people, acquire the bulk of their life savings late in their life, capital lost in down years, makes all the difference in the world–not only in terms of our mental health and financial stability–but also in terms of lasting net benefit for capital risk taken.

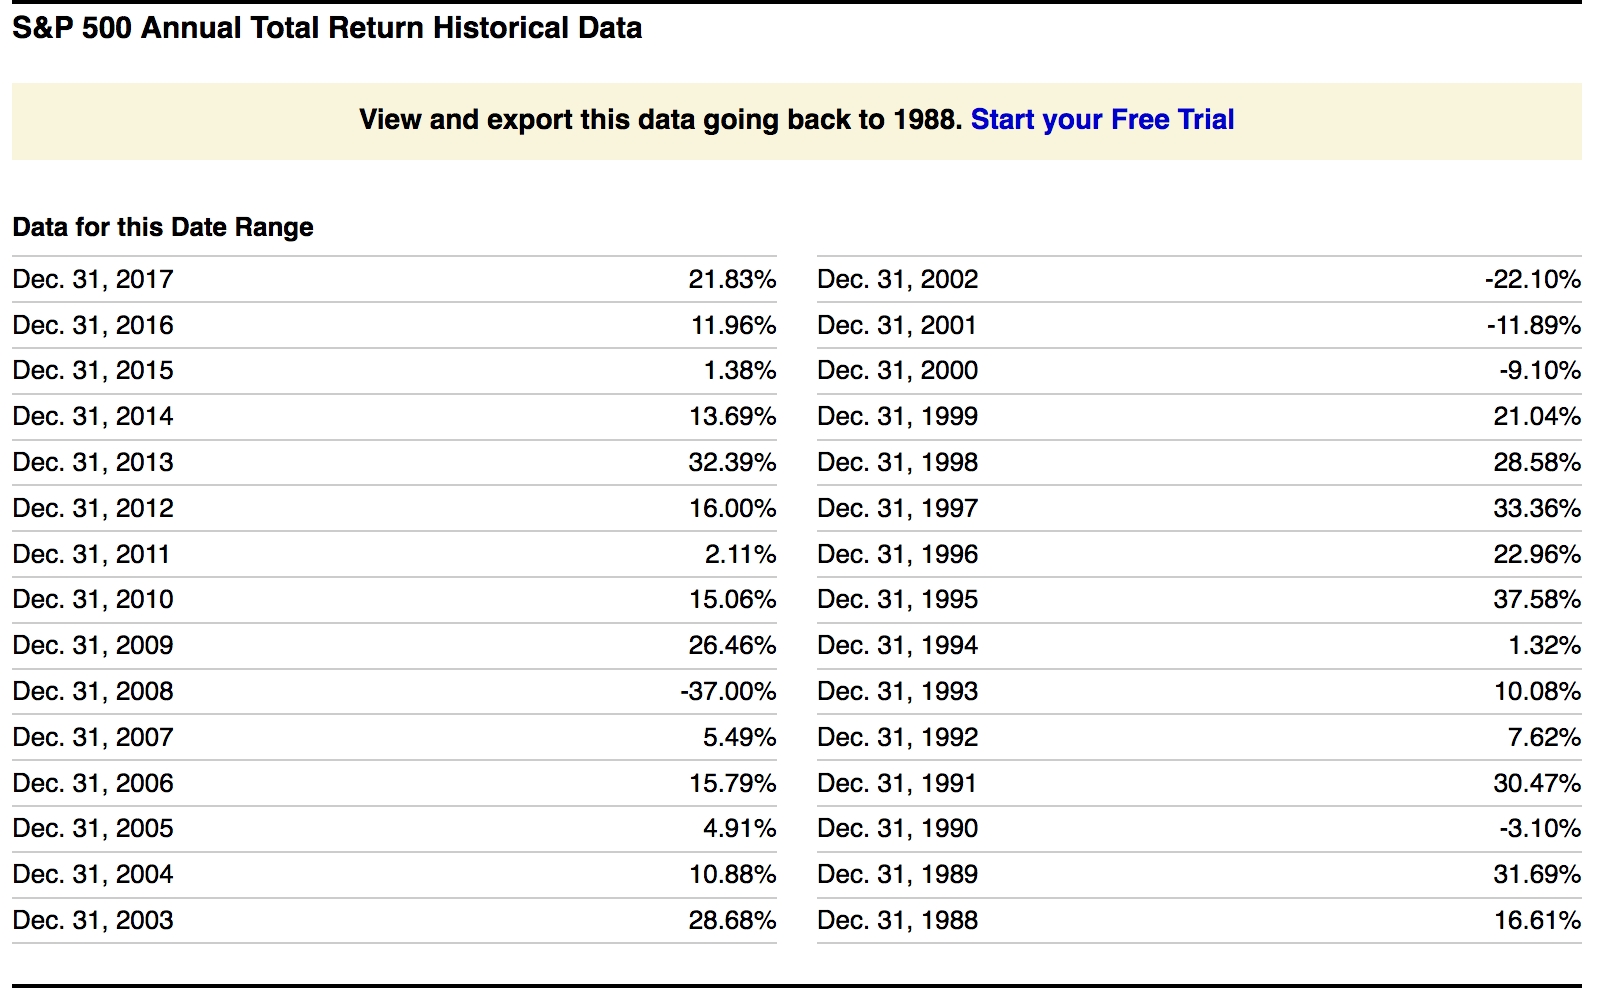
Let’s take this table of S&P annual total returns since 1987 courtesy of Ycharts.com.


Table source: YCharts.com

At a first glance, all seems very encouraging with positive index returns in all but 5 of the last 29 years.  Where do we sign, right?  Stay tuned for some critical disclaimers.

First, total return numbers assume that every dividend received is reinvested quarterly without any fees being paid, withdrawals being made, or lump sums being added at any price peaks along the way.  Why does this matter?  Because without these fantastical assumptions, compound return numbers decline dramatically.   But for the sake of argument, let’s work with these fantasy-best-possible-return assumptions for a moment.

Suppose for example, you were happily holding a chunk or your life savings in US stocks at their last secular valuation peak in December 1999, just in time for the mean reversion phase that saw prices decline over the next 3 years.  Assuming you didn’t panic or need to sell and raise cash for any unforeseen reason, like say a job loss or business income decline, assuming you held on, prices began to recover in 2003, so no big deal right?

Well except, as shown above–if you were brave and held on, and didn’t pay any fees, or withdraw any cash or use any dividends to pay for anything at all–you still had to wait 7 years to December 2006 for your capital to grow back to where it started at December 1999.  And that’s not all.

After finally making some net gains in 2007 as stock valuations peaked out once more, you then hit the snake ride of 2008, which took your principle some 30% lower than where you had started in December 1999.  So now, you’d been ‘investing’ for 9 years with a -32% return for your trouble or an average compound return of -3.6% a year.

So, now you’re 9 years closer to where you hoped to retire, and say you stick with it, don’t panic, don’t sell anything, or pay any fees, or withdraw any income to pay your expenses or help you through the ‘great recession’; for argument’s sake, let’s say you’re very brave and you stay in and you’re still there when markets rebound again starting in 2009.

It now takes you another 3 years, all the way to December 2011, to get back to where your savings started, 12 years earlier in December 1999.  Ok, so say, you didn’t lose heart, or have to make any withdrawals for income or unexpected expenditures or fees, or to try and calm chronic insomnia, say you hung in and have ridden central bank QE-waves into the end of 2017.   Congratulations, you have now enjoyed notional gross returns of 5.4% a year over the last 18 years!

Except, it’s 9 years since the last recession and bear market, and no decade since 1880 has ever passed without at least one.  The average loss in a mild bear market is 25%, if that was to happen in 2018, that would take your savings back to where you were about 5 years ago, and reduce your notional net return since 1999, back to 3.3% a year over the prior 20 years.  You would have done better in government bonds and GIC’s with zero market risk, but kudos to you for sticking with the investing thing.

But here’s where the plot thickens.  With stock valuations today, once more at secular highs, not seen since December 1999, the average historical market decline from here is not 25%, but greater than 50% (as we saw most recently in 2000-03 and 2007-09).

If that pattern repeats this cycle, your savings in stocks are likely to be at least halved once more.  Best case scenario (again, assuming you withdraw no income or capital for anything at all, and keep reinvesting every dividend in more shares every quarter) your capital should be back to the level it was some 6 years earlier in 2012 or so, and your 19-year notional compound return at that point will be 1.33% a year.  That’s a best case scenario.

Financial sales firms insist that timing is irrelevant and stocks are always a good investment. And yet real life insists that timing and market cycle valuations are everything.

Critical time frames for real life investors are 10, 15 and 20 year periods.  For this reason, it’s not time in markets that defines our net outcome.  It’s not about what markets do in up years–the ladders– it’s what they do to our savings in down years –the snakes–that define any net benefit we retain over full market cycles from peak to trough.

We cannot see the future to know exactly where the snakes start.  But we can use practical risk management, long-term cycle analysis and valuation measurements to know when they are due and how best to avoid them.  Without this, real life returns confirm, we are better to not play the stock market game at all.


Posted in Main Page | Comments Off on Fun with S&P 500 snakes and ladders