As Canadian household debt hit an all time high in 2017 (see chart), 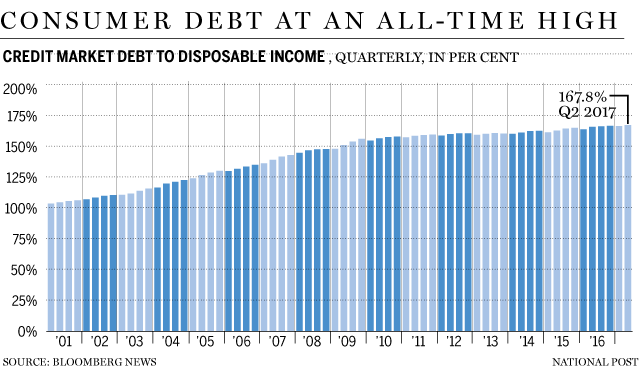 a new study by TD Bank finds that 97% of Canadian homebuyers say they wish they’d factored in their other financial obligations when determining the mortgage they could afford. (Too bad their mortgage broker/architect/advisor was not required to factor these ‘obligations’ into their loan approval consideration either.) We are not talking about extraordinary, unexpected expenses here: 54% of those surveyed wish they’d considered property taxes and maintenance costs, and a third cite overall lifestyle expenses.
Lenders have been encouraged to be more lax in their approval process, because Canadian taxpayers are backstopping some 55% of Canada’s $1.6 trillion residential mortgage loans –$496 billion through CMHC, plus 90% of the $400 billion+ underwritten by Genworth MI, plus an undisclosed exposure through Canada Guarantee co-owned with the Ontario Teachers’ Pension.
Presently Canadian mortgage defaults are near cycle lows: less than .5% of residential mortgages held by the largest lenders are today considered delinquent (behind on monthly payments). But as acknowledged in the CMHC Q2 financial report:
The most important vulnerability is Canada’s high level of household debt, which could amplify the impact of an economics shock if indebted households begin to deleverage or struggle to repay their debt balances…
With property prices in major Canadian markets today considered the most over-valued in the world, it is prudent to consider what happens if when property prices mean revert, potentially taking prices below outstanding mortgage amounts, so that owners are ‘underwater’ as seen in the 2006 US housing bust.
All insured residential mortgages in Canada are ‘full recourse’ meaning that if a borrower defaults and the property sale recoups less than the mortgage, the insurer pays to make the lender whole, and then sues the borrower to recoup the shortfall. But with so many high-ratio mortgages outstanding (minimal owner equity) along with other large unsecured consumer debts, and typically low liquid savings, the incentive for the debtor to file for bankruptcy is large.
As Canadian insolvency manager Scott Terrio points out in MacLeans this week, in the event of a shortfall (and default), the balance owing becomes unsecured—just like any credit card or unsecured line of credit—and the lender must then rely on civil court to collect on the loss (shortfall). But a lender cannot take court action when a Canadian insolvency proceeding is underway, nor afterward as the debts are then legally discharged. See: Here’s how Canadians could walk away from their homes if house prices fall:
“…you can essentially walk away from your home in Canada, no matter the amount of the shortfall, if you file a bankruptcy or a proposal with a Licensed Insolvency Trustee. The estimated shortfall gets included as a normal unsecured debt for which the lender files a proof of claim, and it is discharged. No other recourse is available in the courts to the lender.
In my experience, this is a very little-known fact, even among those who are quite financially sophisticated…
The bottom line: in bankruptcy and creditor proposal filings, defaulting Canadian homeowners will leave losses with their lenders. And where those losses have been insured by the Canadian government, the losses will flow to us taxpayers. In the clean up phase of the largest property bubble in Canadian history, this is likely to happen more than most imagine possible.