Canada firing on one cylinder in May

Market commentators were ebullient last week on the outdated news that Canada’s May GDP estimate was .6% versus the .2% projected by the consensus. Here is a chart of the last 6 months.
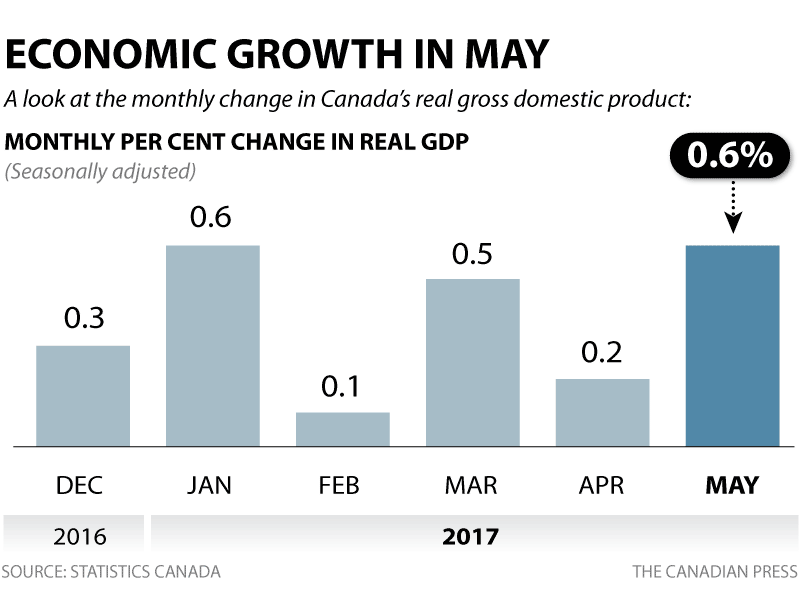
The driver?  Oil and gas extraction increased 7.6% on a snapback following the oil sands fire of last May and another that knocked a major Syncrude upgrader offline earlier this year. Of course, the world has high inventories of oil and lots of capacity today, so pumping out more from the oil sands is likely to help keep prices lower for longer…not great for joyful revenue targets.

Manufacturing by comparison grew 1.1% in May, while construction declined 0.6% and real estate, rental and leasing shrank by 0.2%.

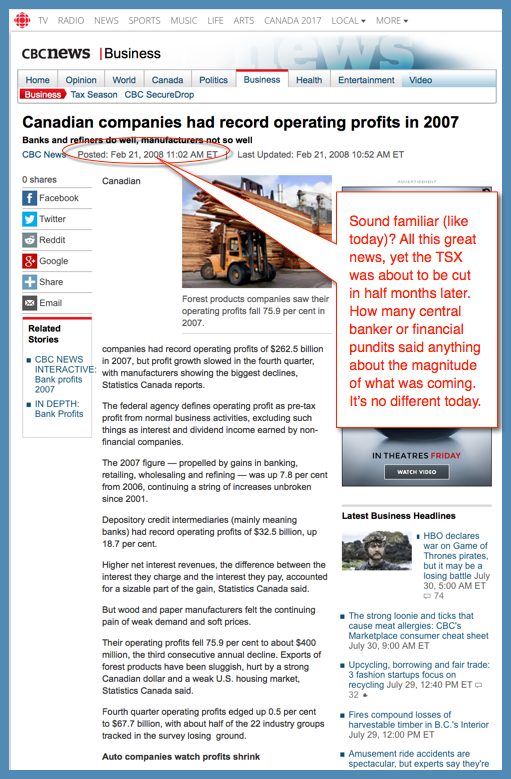
Most importantly, with the Bank of Canada hiking into the consumer debt storm in July, and the US Fed not, the Loonie bounced 10% against the Greenback since April. With Canadian households buried in debt and the red hot realty sector bleeding at the moment, export hopes to our largest trading partner are up for revision.   All the while, the long-always, sell-side army is pumping up its earnings targets for Canadian companies.  Spoiler alert:  they did the exact same thing in 2007-08 as captured in this article from 2008.
What happened next should be seared in the memory of everyone with some savings to lose.  This chart shows the Canadian stock index (TSX) since 2007, today back below the cyclical peak reached 9 years ago in July 2008.


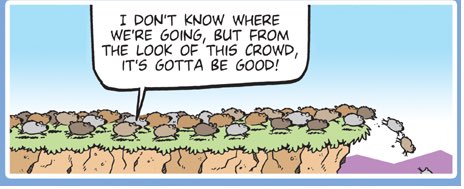
A run-of-the-mill bear market decline of 25% from here would take the Canadian market all the way back to where it was at its secular top in 2000—17 years ago!  That’s what happens when we ignore valuations:  lots of risk and wild capital swings, with no rewards to show for it.  Irrational valuations create secular bears that persist until mean reversion takes prices back to attractive investment prospects once more.  Facts must be faced.

We cannot compound returns when capital looses big chunks and takes years to grow back again.  This is not investing, its Russian roulette.   Blind faith in the financial sales force will get you pain and suffering every time.  The price we pay is the most defining feature of investment returns over time.  History promises us that better prices are coming for those who can wait.
 

Posted in Main Page | Comments Off on Canada firing on one cylinder in May

720 Global: 22 reasons to not follow the herd

One of the better summaries of fundamental/valuation problems with present investment conditions came last week courtesy of Michael Lebowitz, CFA at 720 Global.  Here is a link to the pdf list and below are some of my favorites. 

Read ’em and laugh or weep?  Depends on your perspective (and current holdings!):

Equity/Bond Valuations

  • The S&P 500 Cyclically Adjusted Price to Earnings (CAPE) valuation has only been greater on one occasion, the late 1990s. It is currently on par with levels preceding the Great Depression.
  • CAPE valuation, when adjusted for the prevailing economic growth trend, is more overvalued than during the late 1920’s and the late 1990’s. (LINK)
  • S&P 500 Price to Sales Ratio is at an all-time high
  • Total domestic corporate profits (w/o IVA/CCAdj) have grown at an annualized rate of .097% over the last five years. Prior to this period and since 2000, five year annualized profit growth was 7.95%. (note- period included two recessions) (LINK)
  • Over the last ten years, S&P 500 corporations have returned more money to shareholders via share buybacks and dividends than they have earned.
  • The top 200 S&P 500 companies have pension shortfalls totaling $382 billion and corporations like GE spent more on share buybacks ($45b) than the size of their entire pension shortfall ($31b) which ranks as the largest in the S&P 500. (LINK)
  • Using data back to 1987, the yield to maturity on high-yield (non-investment grade) debt is in the 3rd percentile. Per Prudential as cited in the Wall Street Journal, yields on high-yield debt, adjusted for defaults, are now lower than those of investment grade bonds. Currently, the yield on the Barclays High Yield Index is below the expected default rate.
  • Implied equity and U.S. Treasury volatility has been trading at the lowest levels in over 30 years, highlighting historic investor complacency. (LINK)

U.S. Economy

  • Real GDP has grown 1.97%, .83% and .69% over the last 3, 5, and 10 years respectively.
  • The Federal Rese22rve forecast for real GDP is 2.05% and 1.90% for 2018 and 2019
  • Federal Government Debt to GDP is 105.86%, almost 2x higher than year-end 2000. 720Global optimistically forecasts it to be 130% within ten years. (LINK)
  • Government deficits are forecast to grow at 3x the rate of GDP through 2027

Posted in Main Page | Comments Off on 720 Global: 22 reasons to not follow the herd

Tesla Model 3 critics: “this changes everything”

In 2014 Tesla made all of its technology open source to help other car companies along in their transition to electric vehicles.  Slow on the uptake, most have finally seen the future and announced timelines for delivering their own EV lines at last.  See:  Tesla’s Model 3 has dramatically changed the car industry.  They have a lot of catching up to do.  See:  I just drove the Tesla Model 3 and it changes everything–the entire world will want this car:

“…the Model 3 is going to blow many, many minds. This is easily the most attractive entry-level luxury, all-electric car on the market.

I drove it for no time at all, but I’ve driven pretty much every other all-electric car you can buy, and I can safely say that the Model 3 has no competition.

…there isn’t anybody who’s going to sit in the driver’s seat of this car and not want it, if only briefly. The Model 3 stokes immediate desire, and the lust lingers. That truly changes everything.”

Here was the reveal Friday night.  Here is a direct video link.

Model 3 Profile Midnight Silver EMBARGOED DO NOT USE

Posted in Main Page | Comments Off on Tesla Model 3 critics: “this changes everything”