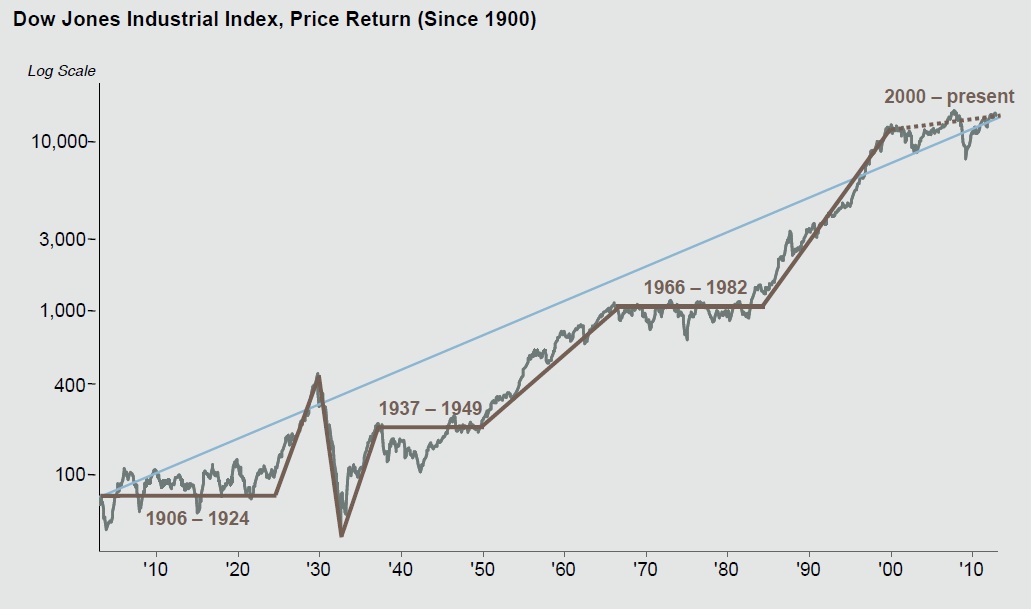
With the practically unanimous bullish sentiment today (not that most commentators are saying the economy is good, but most are betting bullish anyway with explanations that “they have no choice” or low yields are forcing them to strap on risk, their clients can’t wait etc. The following long-term chart of the Dow Jones Industrial Average serves as a good reminder of the length and breadth of secular bear periods including our own. It also shows us why present euphoria about the US markets now revisiting their 2007 peak (5 long years of a wild ride to no where), may end up being just one more cyclical swan song in 15 to 20 years of financial carnage.

Source: J.P. Morgan Guide to the Markets
Unless maybe this time is different and global markets have now completed this secular bear that began in 2000 in record time, ending at record highs in price and bullish sentiment. You know maybe the perma-bulls are right. With price multiples historically stretched (Shiller PE above 21), anemic yields that don’t even pretend to compensate for capital risk, levered players the most bullishly bet since 2007, fear (the VIX) collapsing, investors intelligence survey counting twice as many bulls as bears, ever-optimistic equity analysts now predicting S&P earnings growth of 12% in 2013 (notwithstanding that 90% of the 2012 S&P 500 earnings growth came from just 10 companies while the rest struggled!), while leading indicators like the US ISM orders and ECRI index all continue to signal a weakening economy, and this before the minimum 1.5% US GDP loss that the recent tax hikes and minimal spending cuts in March will bring.
It’s true, what could possibly go wrong here?


Let’s see …
http://business.financialpost.com/2013/01/09/why-more-and-more-market-experts-are-getting-worried-about-stocks/
This time is different.
There’s been an interesting development in the area of measuring investor sentiment.
TD Ameritrade introduced a new sentiment indicator yesterday that could eventually become a better measurement of retail investor sentiment than current methods. They will measure the risk appetite of its 6 million customers based on their actual trades during each month, using a proprietary formula that will score the riskiness of new positions taken during the month. It will take some months to fine-tune the methodologies, and then some time for readings to take on meaning as to what constitutes high or low extremes of bullishness or bearishness.
At some point the markets will recouple with reality. The question is, under what circumstances?
One reaction that I have heard repeatedly from a wide range of market watchers (economists, analysts, etc.) is that they could never have anticipated the scale of the policy response and the unorthodox tactics used by the Fed and other central banks. Many of them have been utterly surprised and dumbfounded by the actions taken by central planners.
It seems that the deluge of money pumped out by central banks has simply overwhelmed the fundamentals, with the stock market becoming a huge inflation sink, rather than the real economy where velocity has been declining. Think of it, if you want to create money without caused large increases in consumer prices, the stock market is great place to direct all that excess ‘liquidity.’
More than any fundamental factors, the single greatest influence on market prices is capital flows. The world could be going to hell in a handbasket, but if there is demand for an asset (whether based on fundamentals or not) prices will climb––a fact that Jens O. Parsson identified when he first analyzed the Great Inflation that began in the 1960’s. Stocks are a type of real asset (even though they are paper), so monetary inflation naturally drives up prices of stocks. And even though velocity may be very low, one cannot deny that we are in the midst of the greatest monetary inflation in the history of the known universe.
Again, at some point reality must set in. But will this realization occur during an economic boom or the current, seemingly endless stagnation. Until then, the ‘rules’ have been temporarily suspended.
Based on the chart above the record time for completing the secular bear is ~ 12 years from 1937 to 1949. We are already at 13 years. On closer examination I guess that bear started in 1929, so it lasted 20 years; but it did have a good bull run from about 1932 to 1937; kind of like the current situation.
I might have drawn the blue line on the graph to hit the start of year 1966, lowering the slope a little.