Conventional investment management principles and precepts about equities as long-term growth engines have been a disaster for real life people since at least 1997. Herd think, hubris and investment salesmanship have all helped to move asset prices from undervalued, high probability holdings in the early 80’s to insanely valued, reckless bets by the late 90’s.
Most unfortunately however, for all of those banking that this “bad luck” is now behind us, it is critical to appreciate that a full 15 years later, equity prices today remain in the “most likely to implode than improve capital” category. Although most money gurus and media types seem to exist in a world of fantasy, esoteric theory and denial–for understanding, I find it most helpful to review the math of loss in real money terms for real life people. For reference lets look at a couple of big picture charts. First we’ll start with that bell weather of best businesses in the world: the S&P 500, here:

Source: Cory Venable, CMT, Venable Park Investment Counsel Inc.
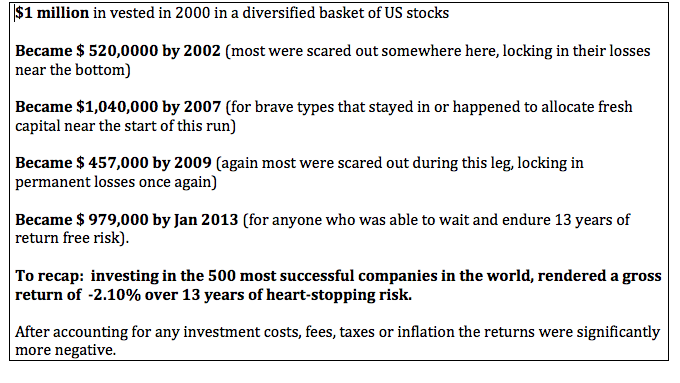
Starting from 1997 to 2000 we see stock prices take off in a parabolic fit of euphoria. All those who had shunned equities or had no investment capital when prices were cheap and then reasonable in the 80’s and early ’90’s came flooding into them in the final three years of the late great bull that ended in 2000. Since then we see that stock prices have been through a series of manic episodes on the road to literally no where. To make this clear, here is the math:
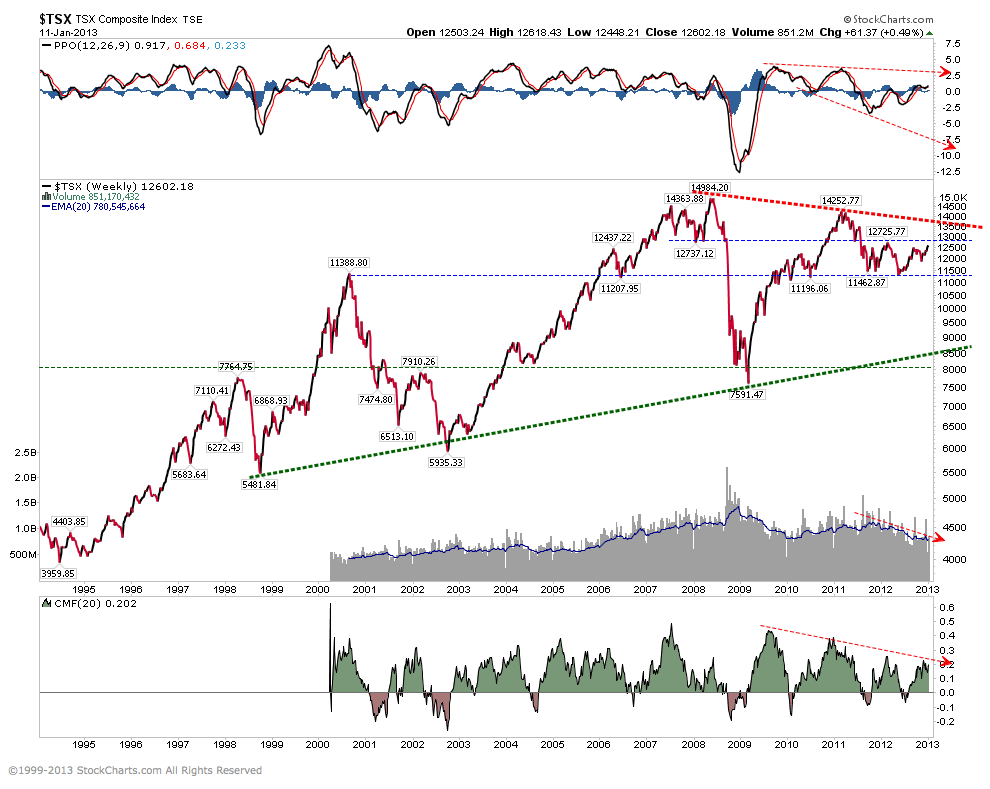
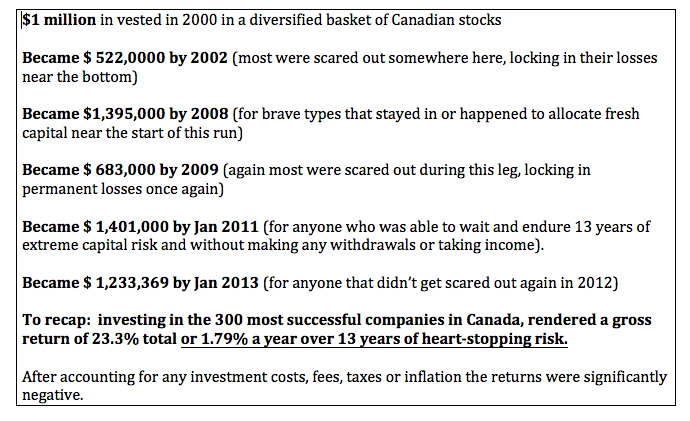
 What about international diversification? Actually the lion share of international markets have fared worse than the US market over this same time frame. A “stand out” in this bunch would be the broad Canadian stock market (TSX composite index) which has slightly outperformed the S&P 500 as shown here:

Source: Cory Venable, CMT, Venable Park Investment Counsel Inc.
And here is the real life effect on savings sacrificed invested.

So what is the conclusion here. The facts remain that stocks today are once again dangerously over-valued thanks to central bank shenanigans, herd think, hubris and investment salesmanship. Now back near secular bear resistance, they are most likely to soon begin another major contraction. The history of secular bears tells us, this third down cycle could very likely take stock prices back toward the long term support of about 800 on the S&P 500 (-45% from present) and about 8500 on the TSX (-32% from present). Just imagine what the long term returns will look like for participants once this next leg completes.
The moral of this story is that stocks today are not a good risk/reward at present levels no matter how impatient or frustrated people may be to sit on the sidelines. Only those with the wisdom and discipline to wait and preserve their liquidity now will be able to profit from the next big fire sale when it finally presents. And that is why most will suffer miserably once more.


Thank you both for the detailed analysis. Bradly indicator for 2013 seems to confirm the forecast of the third leg down. The pivot point is set at end of June. Is the indicator reliable? And, what possible event at the time could trigger the sell off? Langley, B.C.
If the sentiment of retail investors is any indication of market direction, then I think the markets could go much higher from here. I’m not a technical analyst, but just for fun, I can see a potential expanding wedge developing, particularly in the S&P-TSX Composite.
Despite the recent, lofty levels in the S&P, we certainly have not reached rational exuberance territory. Most people I talk to still don’t trust stocks. In fact, they are at or near the point of maximum revulsion, and have shifted their investments to other assets, such as international real estate, precious metals, rental properties, etc.
People are aware that markets are largely a sham, but greed can easily overcome the fear that they may get caught up in some kind of disruptive event (like a flash crash). After a prolonged period of retail outflows from mutual funds, we just got our first positive reading of net inflows. This does not prove a trend, but people are starving for yield and may be willing to take greater and greater risks to get it.
A rising stock market will only draw more people back into stocks for fear of missing the boat.
The Beard@TheFed has done a great job of reflating markets with all that phoney money.
From what I’ve seen, markets usually don’t top until saturation levels are reached and there are not enough new buyers to support further price increases. There certainly seems to be no shortage of money out there looking for a place to go.
Also, many people are expecting another leg down as they think the markets could be doing another ’66 to ’82 pattern. Wall of worry? National Bank’s chief economist forecast the markets at year-end 2013 to be at about the same levels as they were at year-end 2012. Most people I spoke to about this assumed this means another large correction and a rise back to current levels. But I was wondering if maybe, just maybe what will happen is a rather large overshoot of the all-time highs and then a correction back to roughly present levels. Again, based on my assumption that markets still have to climb a lot more before the retail investor comes back in a big way.
Who knows? As far as I can tell––nobody.
BYW, I forgot to thank you, Danielle and Cory for an excellent post. As you mention, adjusted for inflation, the markets are actually much lower than they seem. Looking at markets in real terms is an excellent reality check and a reminder that it’s real wealth and not currency that counts in the end.
After fees and taxes? Fuggetaboutit. Jack Bogle of Vanguard even admitted that if one invests in mutual funds (with their ludicrous MERs), even if markets perform as expected according to long-term averages, after fees, taxes, and inflation, it’s basically a wash. I figured this out for myself years ago, which is why I got out of mutual funds in 2008 (luckily on the very day the TSX hit it’s all-time high).
1 million dollars US invested in GOLD BULLION in 2001 would be worth today:
5.5 million dollars US. Yes, this is a fact.
On another note, I was at the orthopedic office on Friday, and was talking to a desk person on scheduling, and the subject of Medicare came up. She said Medicare is crappy, they are always cutting the payments back AND she said that starting in 2014 the Medicare premium part B is going from $ 106.00 per month to (get this) $ 240.00 per month!!!!!!!!!!!!!!!!!!!!!!!!!!!!!!!!!!!!!!!!!!!!! This is the second time I heard this little tidbit. Can you imagine the shock of the entire US baby boomer population now just entering the Medicare years going to be socked in the jaw with an UNSEEN expense and UNPREPARED FOR EXPENSE like that one? Thats an additional $ 134.00 per month hit to the social security checks on top of Zero Interest Rate Policy.
Danielle. Is this solely a US type of problem? Do you know anything about this and is this happening to Canadian retirees? Where on earth will this increase for ACA (ObamaCare) going to come from OTHER THAN FORCED REDUCTION IN SPENDING ON OTHER STUFF. Am I wrong on this Danielle? Please contribute!
I have no idea what level the stock indexes will be at the end of 2013. I suspect the US Goobermint will not allow them to fall much. Since the stimulus required to prop up the Wall Street Ponzi Scheme over the next several years will add several trillion dollars of debt I suspect eventually we will have a total collapse of the monetary system. We will lose reserve currency status, fuel costs in dollars will become extremely high, driving the economy down, interest on the debt to extreme levels, tax revenues lower, deficits, unemployment and taxes higher, prices of goods very high, and as many have predicted this will be a “hyperinflationary depression”. It will be ugly. Given the low quality of the electorate (that would reelect a TAL like the Oblabbinator) I doubt the US will survive. It’s sad to watch.
Please feel free to add to my gloom and doom predictions – those of us who care want to have some idea of what is coming.
Note:
TAL = Total All-time Loser
Spoke too soon?
Maybe the inflows into equity funds I mentioned above are not quite what they seem as reported by the MSM humpers. According to Zero Hedge ( http://www.zerohedge.com/news/2013-01-14/putting-near-record-equity-inflow-context ), the inflows into stocks were not from retail investors, but rather, banks.
But if retail investors are still pulling out, then who are HAL 9000 and the so-called ‘smart money’ going to fleece in the next correction? Or do markets, indeed have to go much, much higher from here, as I mentioned above, before a profitable ‘correction’ can occur?
I’m skeptic of formulaic indicators.
By definition, the more broadly they are used, the more they are susceptible to missing their own impact due to the herd fore-running the indicator.
This is not to say that such effective models don’t exist.
Albeit, once they are broadly adopted they must fail as not everyone can benefit thanks to such models.
Danielle,
Your warnings that markets are overvalued and at hi-risk are convincing.
However, isn’t seating on cash risky, too, due to the efforts of central banks to devalue?
Then, what is one to do with her live savings?
Thanks,