
Late cycle-performers, financials and energy are now rolling over to confirm the bear market that small-cap stocks began last November (the Russell 2000 is -16% since).
Word to the wise, as we move now into the slowing growth and inflation portion of the market cycle, commodities, equities, and corporate debt tend to be the worst-performing assets, with energy, tech, industrials and financial companies the worst-performing equities.
Canada’s TSX index concentrated 32% in financials (20% in just the five largest banks) and 13% in oil and gas companies, tends to hold up longer on these late-cycle sectors before tumbling with them. We’re into the tumbling part now. As a basket, Canadian financials (XFN) are so far -5% and oil and gas -8% from mid-January highs.
As in 2000 with Nortel and 2008 with Research in Motion, Canada had a tech standout this cycle, Shopify, which soared during the pandemic, dubiously becoming the most expensive Canadian company when it peaked with the TSX in November 2021; it’s -46% and the broad market -5.6% since.
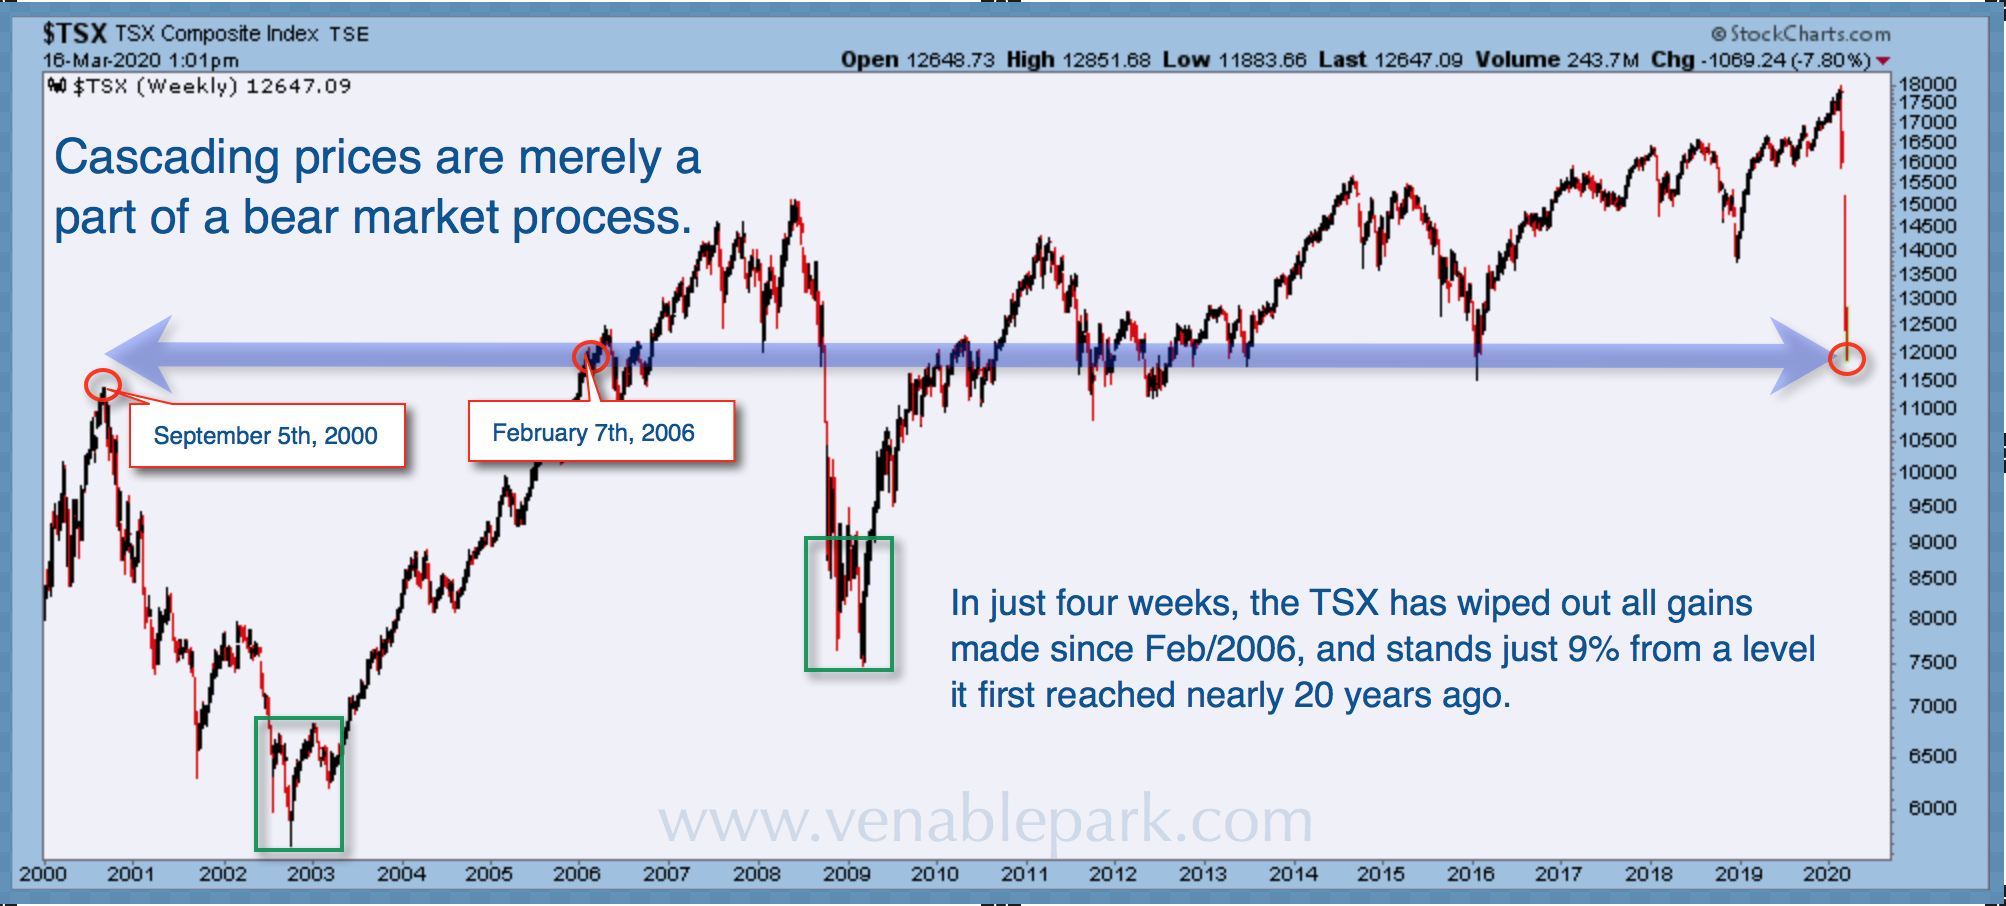
A further 10% decline from here will return the TSX to its February 2019 cycle peak, and from there, a retest of the March 2020 lows remains our base case. If the selling were to end there, the benchmark index will have given back all gains made since February 2006 and be (as it was in March 2020) just 9% higher than where it topped in September 2000–now over 21 years ago (circled in my partner Cory Venable’s March 2020 TSX chart below). A best-case scenario would be a retest and hold of its March 2020 low (-38% below present levels).
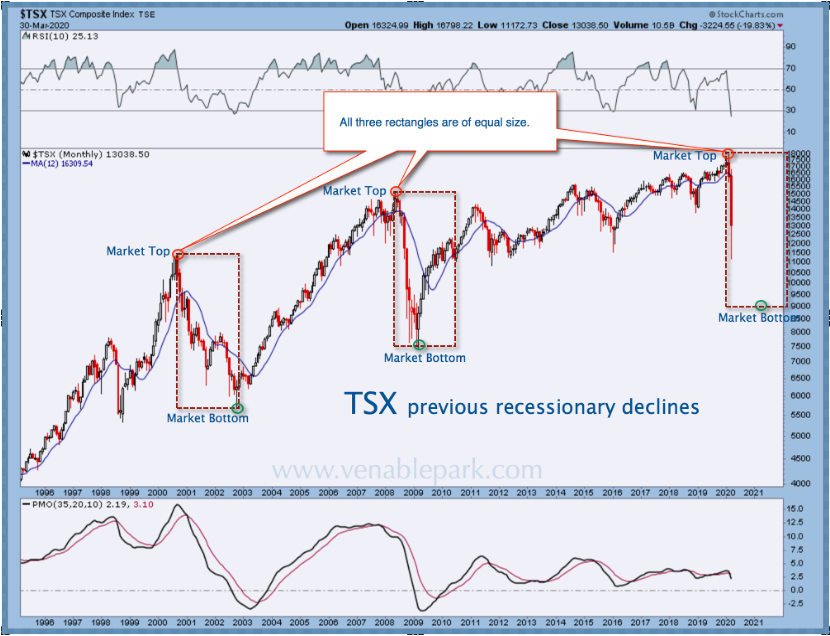
In past secular bear markets during the 1930s and 1970s–beginning from jubilant peaks in sentiment and valuations–markets retested prior cycle lows in successive bear markets over 15 to 20 years. As highlighted in Cory’s March 2020 monthly chart below, this suggests that the Canadian stock market could revisit the 9,000 to 10,000 range for the third time in the months or quarters ahead. This is how secular bears manage to repeatedly maul and finally annihilate irrational exuberance.
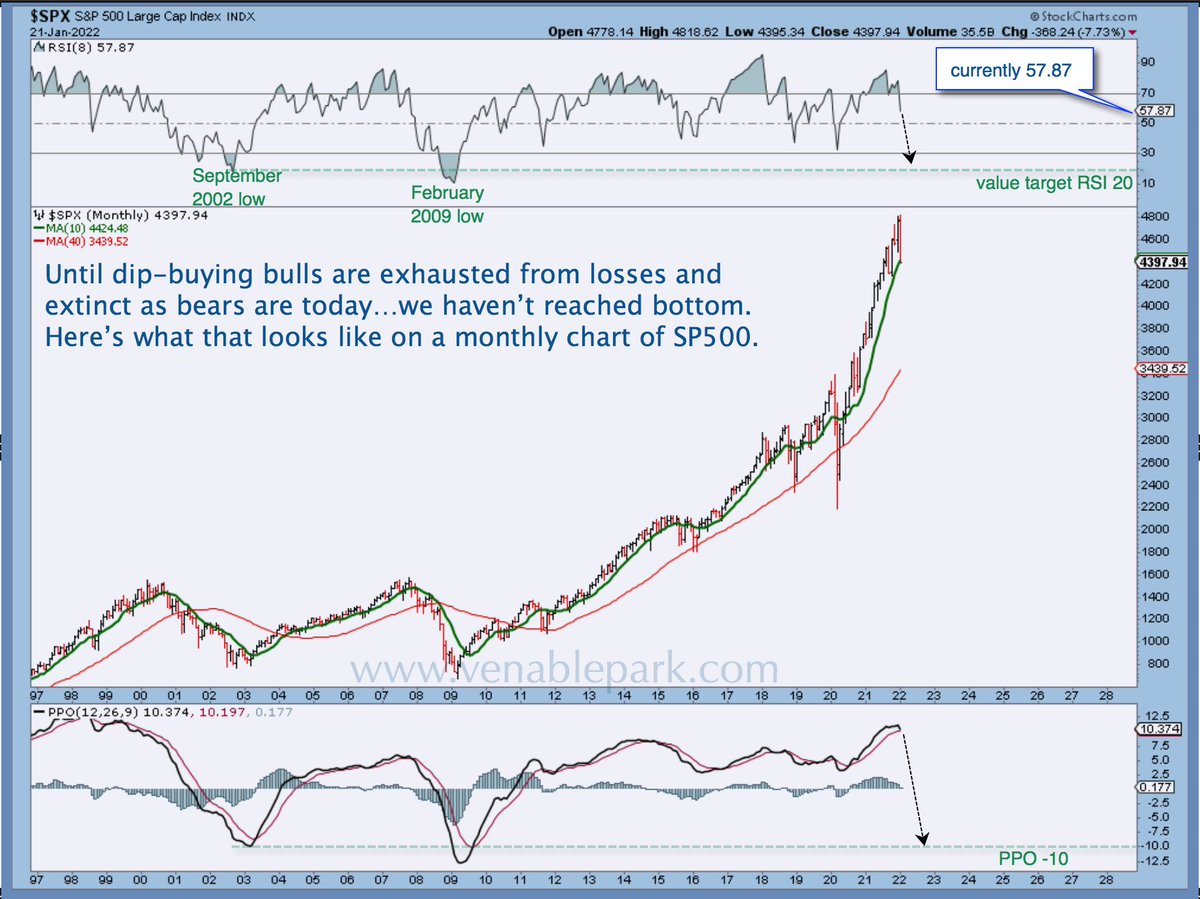
A similar pattern could unfold for the grotesquely overbought S&P 500. As shown in Cory’s latest chart of the index below since 1997, the 9% price decline to date is barely perceptible in the big picture. A durable bottom is very far from nigh with a monthly relative strength indicator (RSI) above 57. A 65% decline from here would only retest the prior cycle tops (the 1500 range) for the S&P! A best-case scenario?
We remain cautiously optimistic that the present downdraft could be the much-needed fourth, and potentially final, cyclical bear of this secular bear period. Still, we note that bear market bottoms are a process that typically takes several months–sometimes a couple of years–to complete (see the rectangles around bottoming action in the TSX charts above).
While the investment sales cartel urges us to never sell and buy at every price, the truth is that we can’t have the mental and financial strength to capitalize on bear markets unless we first protect our capital from their losses and set aside significant cash reserves to buy when present holders are finally liquidating in desperation.
No doubt, there will be exceptional investment opportunities ahead for those who are liquid and prepared for them in advance. But amid the cacophony of confident dip-buyers, remember, when it’s finally a cycle bottom, no one will feel like buying’s a good idea.








