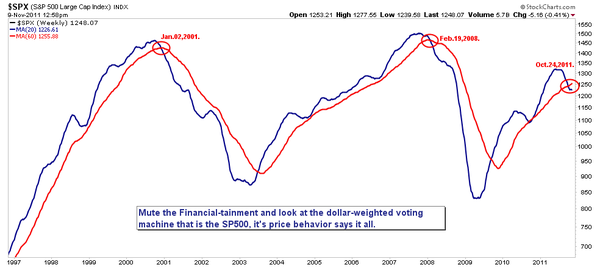
This picture says a thousand words: pretend and extend, jack-up and prop, goose and juice, the weight of the world’s over-indebtedness has gravity on its side.

Source: Cory Venable, CMT, Venable Park Investment Counsel Inc
This picture says a thousand words: pretend and extend, jack-up and prop, goose and juice, the weight of the world’s over-indebtedness has gravity on its side.

Source: Cory Venable, CMT, Venable Park Investment Counsel Inc
MF Global’s Customer Assets – STOLEN – And Nothing You Hold In This System Is Safe
http://jessescrossroadscafe.blogspot.com/2011/11/mf-globals-customer-assets-stolen.html
The worst case scenario isn’t the over indebtedness but the homemade NARI suitcase nukes. Anyway, love the chart. Many thanks. JW, Vancouver.
http://www.theonion.com/articles/bank-executives-on-15th-floor-gambling-on-which-oc,26565/
Another Day, Still All Lies
http://market-ticker.org/akcs-www?post=197335
“No Country For Old Men”…… sometimes evil just can’t be beaten …… I beleive this may just be one of those times.
Oil and Gold are telling us a story today…..oil up gold down…..I don’t want to beleive it but it looks like the crooks may just be going to get away with it …..
Just came across this article on oil…….seems others are belwildered as well…..I think it is less of what ZH is speculating and more about anticiaption by swing traders….we will see but there is absolutely no reason for oil to be trading at 98.00 today unless the “smart money” is expecting a recovery…..or they are just trying to get the last of the dumb money in before the smackdown……fun and games…..but not for old men.
http://www.zerohedge.com/news/wti-breaks-98-disconnect-commodity-complex-widens
Why the 20 week and 60 week moving averages and that particular cross? 20 week would be 100 day and I have seen other technical analysts reference that. 60 week would be 300 days which I haven’t seen referenced anywhere else. Now I have seen the 10 week (50 day) and 40 week (200 day) moving averages utilized and that particular cross (golden or death) but there have been a few false death crosses such as summer 2010. No offense, but I can’t help but wonder if the 20 week and 60 week were simply backfit to the time period to show the “right” sell signals while missing the whipsaws such as 1998, 2004, or 2010 that other moving average systems captured.
This note from Cory: “As long as the MA’s are related ie divisible they can be used together, whether they’re robust enough is a separate question. I find it useful to seek out non-traditional measures that are longer to remove the trading noise that occurs around the time frames such as 50/200…10/40 and fractals of same. Even in the chart presented you will note a slight whipsaw. Whipsaws are dealt with using simple time and price filters on penetration amounts. The focus of the chart is to remove the noise so as to uncover the underlying sentiment. And it is just one of many filter sets and indicators that we look at. CV
http://chart.ly/xw4wcla
I echo an earlier poster saying you have to be careful handpicking MA’s to get market direction. For example the above chart would seem to indicate higher movement for S&P